

In trading, understanding market patterns is key to making good decisions. The most talked about patterns are the “bull” and “bear” patterns, two opposing signals that tell you if the market is going up or down. These patterns are the pulse of the financial market, giving you clues about where the price is going. Knowing how to recognize these patterns will help you predict future trends and get in and out of trades at the right time. This article will go through the differences between bull vs bear pattern and how to master them.
II. What Are Bull and Bear Patterns?
A bull pattern is an up move. Imagine a bull pushing with its horns – that’s what this pattern does to prices. When traders see a bull pattern forming they know the market is going up and prices will rise.
A bear pattern is a down move. Like a bear swatting with its paws – that’s what this pattern does to prices. Traders looking for a bear pattern know the market is going down and prices will fall.
Both of these patterns are essential in trading because they help signal the overall direction of the market, providing traders with the opportunity to make timely decisions.
III. Understanding Bullish Flag Patterns
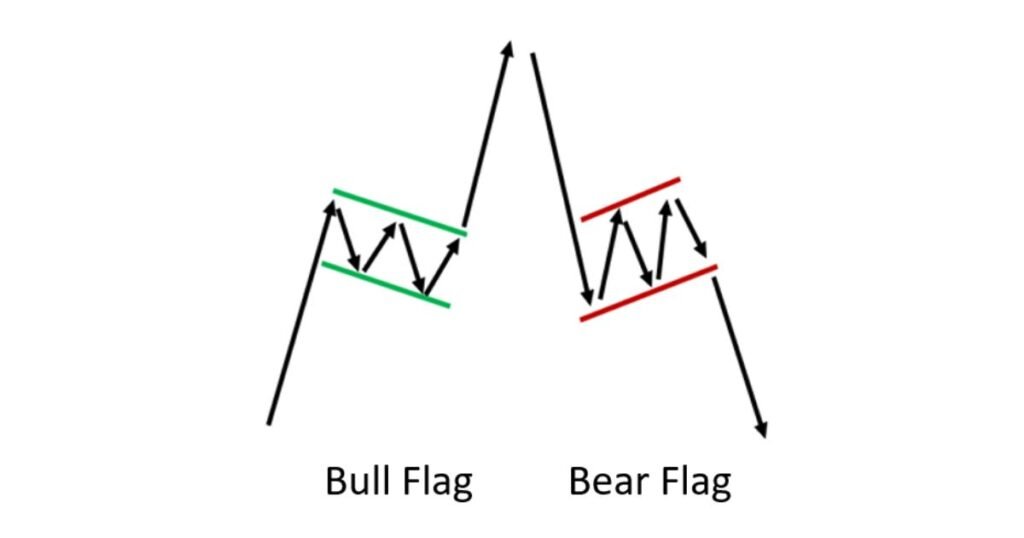
One of the most common bull patterns is the bull flag. It looks like a flag waving on a pole. It starts with a sharp up move which forms the “pole” then a period of consolidation or sideways move which forms the “flag”. Traders take a breather after the sharp move up but the trend usually resumes once the flag is complete.
Bull flags are seen in uptrending markets where buyers are in control and pushing prices higher. Remember these patterns are strong trend continuation signals, meaning the market will keep going up after the flag is complete.
For instance, imagine a stock price shoots up and then pauses and goes sideways for a short period. That sideways move is the consolidation phase and when the price breaks out of the consolidation it’s a signal the market will keep going up.
IV. Understanding Bearish Flag Patterns
Just as there are bull flags there are bear flags. These patterns signal a downtrend and look like their bullish counterpart but in reverse. A bear flag starts with a sharp drop in price which forms the “pole” then a period of sideways movement (the “flag” as traders pause to reassess the market before it continues down.
Bear flags often form in a down-trending market where sellers are in control and pushing prices lower. Once the flag is complete and the price breaks down it’s likely the market will continue to go down.
For instance, a trader sees a sharp drop in price and then a brief period of sideways movement. The sideways movement is the flag and when the price breaks down it’s a strong continuation of the downtrend.
V. Key Differences Between Bull and Bear Patterns
The main difference is the direction of the market they point to. A bull pattern means the market is going up, prices are rising. A bear pattern means the market is going down, prices are falling.
In terms of trader sentiment, a bullish momentum means the market is optimistic, and traders are expecting prices to go up. Bearish pressure means fear or pessimism, traders are expecting prices to go down.
Another difference is the timeframes in which these patterns form. Bull and bear patterns can form in any timeframe, from minutes in intraday to weeks or months in the long term. Recognizing the pattern quickly is key to making timely decisions as markets move fast and hesitation can mean missing out.
VI. Advantages and Challenges of Trading Bull vs Bear Patterns
Advantages:
- Clarity in trend continuation: Both bull and bear patterns offer clear signals for when a trend is likely to continue, giving traders high-confidence setups.
- High-probability setups: Whether the market is moving up or down, these patterns provide reliable signals for entering trades in both directions.
Challenges:
- False breakouts: Not every pattern leads to the expected outcome. Sometimes, what appears to be a bull or bear flag may break in the opposite direction, leading to losses.
- Pattern misinterpretation: It’s easy to mistake a pattern or enter a trade too early, only to see the market move against you. Timing is crucial, and misreading the market can result in costly errors.
VII. Trading Strategies for Bull vs Bear Patterns
When trading bull vs bear pattern, it’s important to develop entry and exit strategies. For a bull flag pattern, traders often enter the market when the price breaks above the consolidation phase (the flag) and set a stop loss just below the bottom of the flag. Similarly, in a bear flag pattern, traders may enter a short position when the price breaks below the consolidation and place a stop loss just above the flag.
Risk management is also key. Only risking a small percentage of your account on each trade helps protect you from large losses. Additionally, using confirmation indicators, such as volume or moving averages, can improve your chances of success by confirming the pattern before entering a trade.
VIII. Common Mistakes to Avoid When Trading These Patterns
One mistake traders make is relying too much on patterns and not considering other market indicators. Bull and bear patterns can be powerful but use them with other tools to avoid false breaks.
Another mistake is ignoring market conditions or news. External factors like economic data or global news can cause big market moves that break patterns.
And finally, poor risk management can turn a winning trade into a loser. Without setting stops or managing your risk you can blow up even the best setups.
Want to know about cup and handle patterns?
IX. Conclusion
Learning the bull vs bear pattern is key to better market forecasting and trading with more confidence. By learning to recognize these patterns you can add to your trading strategy and increase your chances of winning. Yes, there are challenges like false breakouts and misinterpretations but the benefits of pattern recognition far outweigh the risks.
For traders looking to level up, understanding and using these patterns is a must. Whether you trade stocks, commodities or forex, bull and bear patterns will give you valuable insights into market moves. Start using them now and you’ll be one step closer to profitable trading.