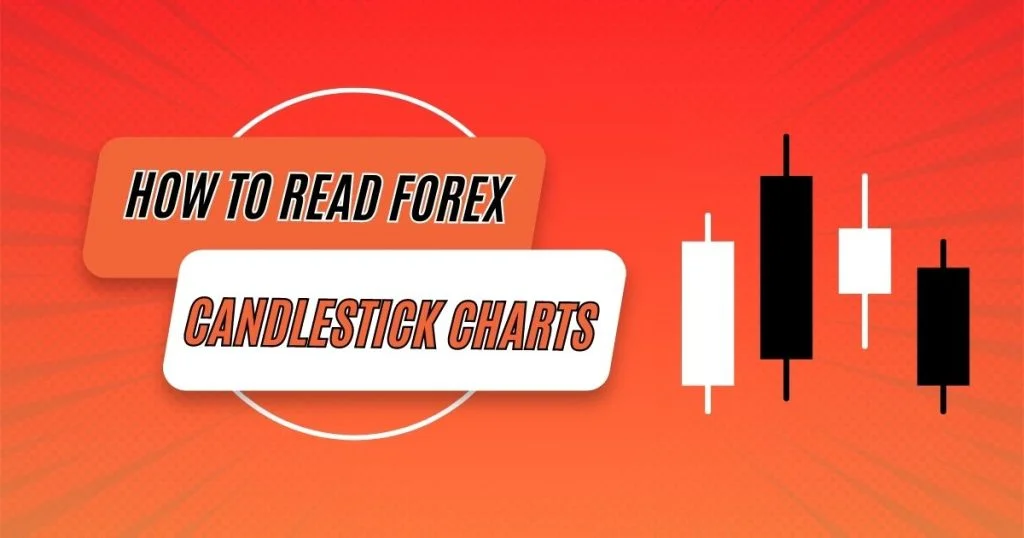
What is a candlestick chart?
A candlestick chart is a chart collected of individual candles, which traders use to understand price value. Candlestick price value includes pinpointing where the price opened for a time and where the price highs and lows for a specific time are.
Price value or price action is a clue to the trend and backtracking for all financial markets. Candlestick form patterns that occur throughout Forex charts which indicate reversals and continuation of trends. Candlesticks can also indicate the buy and sell entries in the market for individual formation. The time that each candle states depend on the time frame chosen by the traders. A common time frame is the daily time frame so that the candle will point to the open, close, and highs and lows for the day. The different tools of a candle can help you forecast where the price might go; for instance, if the candle goes far below its open, it may indicate a further price decrease.

How to read candlestick chart:
Candlestick charts can be read and used in many ways. Candlestick chart tools depend on trading strategy and time frame. Some strategies attempt to take advantage of candle formations and attempt to recognize price patterns. Before we discuss the candlestick chart, we should know the essential elements of the candlestick chart as below:
Candlestick Chart:
In a candlestick chart, there are three specific points, like open, close, and wicks. These points are used in the creation of a price candle. The first point indicates the candle’s open and close prices. These points show where the price of an asset begins and where it ends for a selected period and will make the body of a candle. Each candle shows the price movement for a specific time that you choose or pick out when you look at the chart. If you look at the daily, each individual candle will display the open, close, and price of that day.
Open Price:
The open price shows the first price traded on the action of the new candle. If the price starts to trend upward, the candle will turn green or blue. These colours show the difference on the chart. If the price decreases, the candle will turn red.
High Price:
The top of the upper wick shows the highest price traded during the time. If there is no upper wick, it means that the open price is the highest price, and it may be that the close price was the highest price traded. This is the point to learn the concept of the candlestick.
Low Price:
The lowest price traded is the price at the bottom of the lower wick, then the lowest traded in the same as the close price or open price in an optimistic candle.
Close price:
During candlestick formation, the close price is the last price traded. If the close price is below the open price, the candle will turn red, and if the close price is above the open price, the candle will be green or blue.
The Wick:
The wick is an important tool for a candlestick chart. The wick is also known as the “shadow”. These are the essential points that differ in the price for a certain charting time. The wicks are rapidly distinguishable as they are obviously thinner than the body of a candlestick. Through this point, the power of candlestick becomes visible. Candlesticks can help traders keep an eye on the motion of the market.
Directions:
The colours of the candlestick point out the direction of the price. As I have discussed at the start if the price of a candle is closing above the opening price of a candle, then the price moves upward, and the candle would be green. And if the candle is red, then the price closes below the open.
Range:
The range is the difference between a candle’s highest and lowest price. You can calculate the top price of a candle and then subtract the bottom price, as
( Range= highest price_ lowest price). This is an easy way for the traders to learn about this formula. And this candlestick chart has a clear advantage for traders.
These are all elements we have to study before looking at the candlestick chart.
Further Tips for Reading Candlestick Chart:
When we are going to read the candlestick chart, we should remember these three essential tools:
1: The time frame of trading.
2: Price patterns.
3: Price action.
These are some tips for reading a candlestick chart. In forex trading, the traders should have knowledge of the forecast on currencies, equalities, and gold because these can be associated with you in your trading. Candlestick charts help traders recognize price patterns that show on the charts. The traders would then make a profit.
Advantages of Candlestick Chart:
1: It is endlessly customizable and represents any time of any asset.
2: It has lots of information about highs, lows, opens, and closes and also about the time frame.
3: It is easy to understand by looking at the chart with customizable colours to teach you the patterns easily.
4: If the indicators are relevant to a particular trading system, do their best work.
The Final Words:
Here we have studied How to read the Forex candlestick chart. The candlestick chart is a technical tool for analyzing the forex market. By using a candlestick, you know the time frame of trading, price patterns, and price actions. All of these are some important elements in trading. Trading on a daily basis can give you a better understanding of the pros and cons. By the ups and downs of price value day by day or even an hour. I hope you have learnt about the basic things of a chart.

