

The cup and handle is a well-known chart pattern used by traders and investors in technical analysis. This pattern is named for its shape which looks like a tea cup with a handle, a period of consolidation followed by a potential breakout. By learning and understanding this pattern traders can spot buying opportunities and make informed decisions in the market. This article will cover the characteristics, implications and trading strategies of the cup and handle pattern so you can use it in your trading.
Recognizing the Cup and Handle Formation
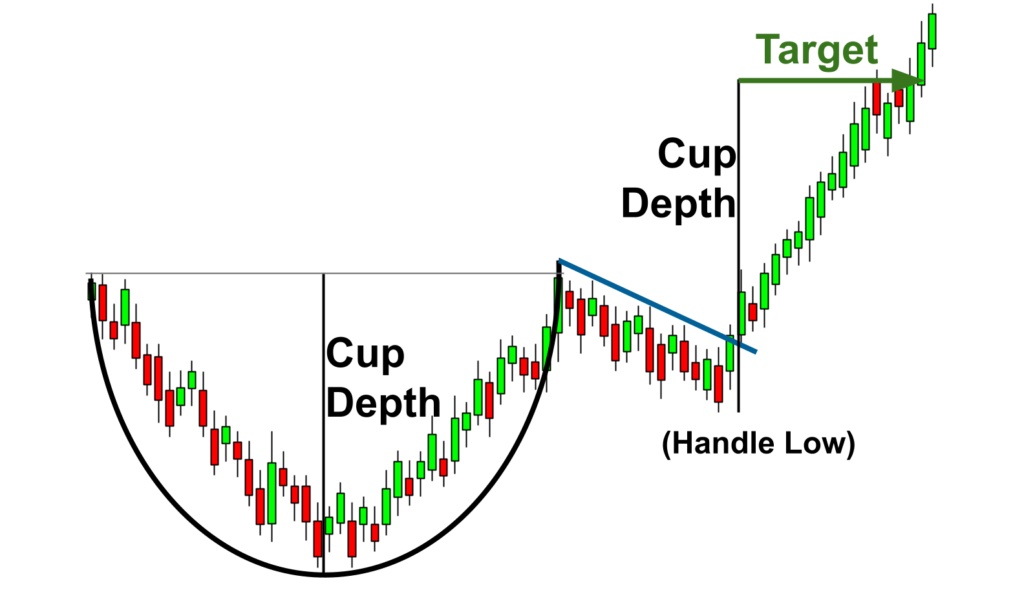
The cup and handle formation consists of two parts: the cup and the handle. The cup is a rounded “U” shape, a period of consolidation followed by a slow rise. The handle is after the cup, a short consolidation before a breakout.
Formation Process
- Cup Formation: The pattern begins with a decline in price, creating the left side of the cup. This is followed by a period of consolidation, forming the bottom of the cup. Finally, the price gradually rises to create the right side of the cup, reaching a level similar to the initial decline.
- Handle Formation: After the cup is formed, the price typically consolidates again, forming a handle. This handle is usually a short-term downtrend or sideways movement.
- Breakout: The pattern is completed when the price breaks out above the resistance level formed by the cup’s rim. This breakout is often accompanied by an increase in volume, indicating strong buying interest.
To see this pattern better imagine a tea cup with a rounded bottom and a small handle on the right side. This shape is the pattern on the price chart so it’s easier to spot during analysis.
Are Cup and Handle Patterns Bullish or Bearish?
Bullish Implications
The cup and handle is generally bullish. This is because it’s a period of consolidation and accumulation followed by a breakout to new highs. Historical data shows this pattern has a high success rate in predicting up moves especially when confirmed by other indicators and volume.
Bearish Scenarios
The cup and handle is generally bullish but can fail or be bearish if the breakout lacks volume or the overall market is against you. Be careful and consider other factors before making a trade based on this pattern alone.
Trading Strategies with Cup and Handle Patterns
Entry is key when trading the cup and handle. The best entry is usually at the breakout above the cup’s rim. Wait for a confirmed breakout with volume to minimize false breakouts.
Risk management is key when trading any pattern. For the cup and handle, set stops below the handle low or the cup low to protect against unexpected moves. This way you limit your losses if the pattern fails.
Cup and Handle Patterns in Forex Markets
The cup and handle pattern can be used in forex just like in stocks. Forex traders look for this pattern on currency pairs to spot bullish trends. The key is to make sure the pattern forms in a liquid and trending market.
The best market conditions for the cup and handle pattern in forex are a stable economy and clear trends. When these conditions are met the pattern can give you reliable signals for profitable trades.
Identifying Cup Handle Patterns in Stocks
In the stock market, the cup and handle is used to identify potential continuations. Traders look for this pattern in individual stocks, sectors or even broad market indices. It’s most effective in growth stocks and strong trending sectors.
Some sectors are more prone to forming cup and handle patterns, especially those with high growth and high interest. Technology, healthcare and consumer discretionary sectors tend to do this more often, so there’s more opportunities.
Navigating Inverted Cup and Handle Patterns
An inverted cup and handle is the bearish counterpart of the standard pattern. It’s an upside down cup followed by a handle, meaning potential down move.
The inverted pattern means distribution followed by a breakdown, so bearish trend. Traders use this pattern to short or exit longs before a potential down move.
Effective Trading Techniques for Cup and Handle Patterns
Adding other technical indicators to the cup and handle pattern will make it more reliable. For example, moving averages, RSI or MACD will give you more confirmation of the pattern and better trades. Volume is also key; a breakout with high volume is more likely to work.
Backtesting your trading strategies with historical data is crucial to know how the cup and handle pattern works. Traders can use different tools and software to backtest and refine their strategy based on the past performance.
Setting Stop-Losses and Profit Targets with Cup and Handle Patterns
Stop-losses are important. For the cup and handle, stop-losses should be set just below the low of the handle or the low of the cup. This limits the potential loss if the pattern doesn’t work out.
Profit targets are just as important. Traders can set profit targets based on the height of the cup, same distance above the breakout. This gives a realistic expectation of the gain and helps you manage your trades.
Final Words
The cup and handle is a powerful tool in technical analysis, you can use it to spot potential continuations. By understanding the formation, implications and trading strategies you can make informed decisions and increase your chances of success. It’s bullish but you must consider other factors and use good risk management to navigate the markets. With practice you can master the cup and handle and achieve your trading goals.