

A price action strategy is an approved trading system that focuses on analyzing the movement of price charts and making trading decisions based on distinguished patterns, trends, support, and resistance levels; Both beginners and experienced traders mostly use this strategy due to its effective policy. In this article, we will learn about the key principles and components of a price action strategy to help traders easily understand and apply it in their trading seek.
The Basics of Price Action Strategy:
In this part, we will analyze the basic concepts of price action, including candlestick patterns, trend analysis, and market structure. Understanding these tools is important as they form the basics of a price action trader’s decision-making process.
Identifying Key Candlestick Patterns:
Candlestick patterns provide valuable awareness of the market sentiment and potential price movements. We will discuss important candlestick patterns, such as pin bars, doji, engulfing patterns, and hammers, and how to explain them to make informed trading decisions.
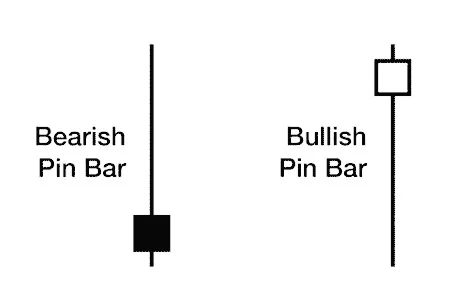
1:Pinbar:
A pin bar is a pattern dependent on one price bar, basically, a candle stick price bar, which represents a sharp reversal and rejection of price. The area between the open and closed pin bar is called its “real body”, and pin bars normally have small real bodies in balancing to their long terms.
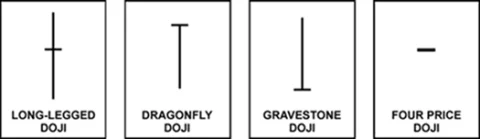
2:Doji:
The Doji candlestick pattern is an important indicator of the technical analysis of financial markets. It forms when the opening and closing prices of an asset are almost similar, resulting in a small or non-existent body. The Pattern suggested delays between buyers and sellers, potentially signalling a reversal or trend continuation.
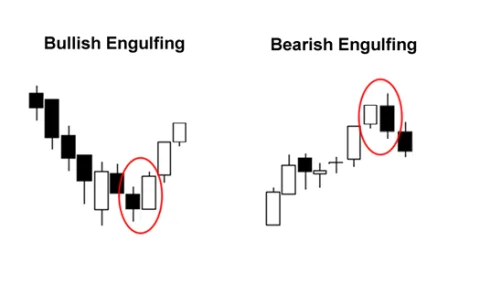
3:Engulfing Pattern:
The engulfing Pattern in the candlestick chart is a two-candle reversal pattern. It appears when a smaller candle is ultimately engulfed in two types of engulfing patterns: bullish and bearish. The bullish engulfing pattern appears when a small bearish candle is engulfed by a large bullish candle, suggesting the beginning of a new bullish trend.

4:Hammer:
The hammer pattern is a bullish candlestick build usually seen in financial charts. It consists of a small body near the top of the candle and a long lower shadow, reaching a hammer. This Pattern suggests that sellers originally moved prices lower, but buyers managed to recover control by the end of the period, directing to a potential trend reversal.
Risk Management in Price Action Trading:
Managing risk is important in trading. We will discuss position sizing, risk-to-reward ratios, and risk management techniques to safeguard capital while maximizing profit potential when implementing a price action strategy.
Support and Resistance Levels in Price Action:
Support and resistance levels act as significant reference points for traders. This section will explain how to identify these levels on price charts and how to use them to make trading decisions, such as setting stop-loss and take-profit orders. Support and resistance are the most widely used technical analysis methods to look for highs and lows for buying and selling opportunities in the financial market.
Candlestick and Support Resistance Combination :
Candlestick analysis on support and resistance involves studying the candle patterns formed at key price levels where the market tends to reverse. Bullish candle patterns (like hammers, engulfing patterns) near support suggest potential upward bounces, indicating increased buying interest. Bearish patterns (like shooting stars, engulfing patterns) near resistance imply potential downward reversals, signalling heightened selling pressure. Combine candle signals with confirmation and risk management tools, considering other indicators for a comprehensive view. Remember, practice and experience are vital, and prudent risk management is essential in trading.
Conclusion:
The price action strategy is a powerful tool that authorizes traders to make well-informed decisions based on the behavior of the price chart. By understanding the basics of price action, identifying key patterns, analyzing trends, and employing effective risk management, traders can increase their chances of success in the dynamic world of financial markets. Continuous practice and learning from real-life examples will help traders develop the discipline and skill required to shine in price-action trading.