

Supply and demand trading is all about understanding how buying and selling pressure affects the price in the markets. It’s simple: when demand is greater than supply, prices go up, when supply is greater than demand, prices go down. These basic economic principles are the foundation of price action in the markets.
Supply and demand zones are areas on a chart where the balance of buyers and sellers changes. For traders, knowing these zones can be gold. This strategy works in all markets, forex, stocks, and commodities. By knowing how to spot supply and demand zones, you can make better decisions and increase your chances of winning.
What Are Supply and Demand Zones?
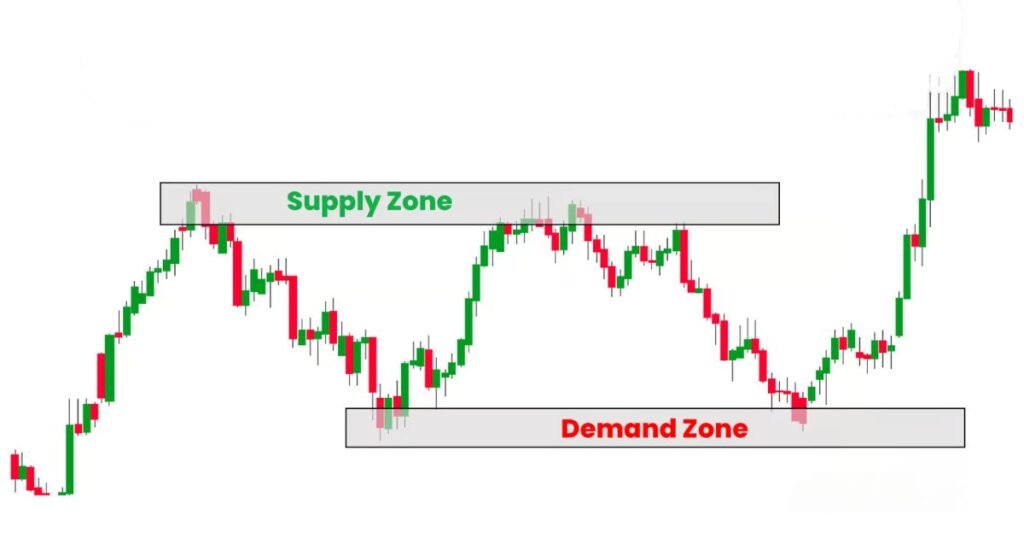
Supply zones are areas on a chart where sellers are in control and prices fall. These zones occur after a big run-up where prices have gone up a lot and everyone thinks the asset is overbought. As more sellers get in the market the price starts to drop.
Demand zones are areas where buyers are in control and prices rise. Demand zones form after a big drop where everyone thinks the asset is undervalued and buying starts to increase. As more buyers get in the market the price starts to rise.
Institutional traders like banks and hedge funds create these zones with their big orders. Their orders can move the market and create visible supply and demand zones. As retail traders, if you can identify where these big players are likely to act you have a big edge in the market.
Identifying strong and weak zones is the key to supply and demand zone trading. Strong zones are areas where price moves away sharply after touching the zone, which means there is a big imbalance between buyers and sellers. Weak zones may not show such a strong reaction so they are not reliable for trading decisions.
How to Identify Supply and Demand Zones on Charts
Finding supply and demand zones on charts can be tricky at first but with practice, it gets easier. Here’s a simple step by step guide to help you:
- Price Action: Look for areas where price has made a big move up or down. These are areas of imbalance which may be a supply or demand zone.
- Consolidation: Zones often form after consolidation where the price moves sideways before making a big move in one direction. This is where institutional traders place their big orders.
- Volume Spikes: Look at volume. Big volume spikes often happen when a supply or demand zone is being formed as institutional players enter the market.
For a strong supply zone, you should look for:
- Multiple rejections of a price level.
- Sharp price drops after the zone is touched.
- High volume during the rejection.
For a strong demand zone, watch for:
- Multiple price bounces off the same level.
- A strong rally after the zone is touched.
- Increased buying volume.
Tools like volume analysis and candlestick patterns can help in identifying these zones. For example, pin bars (candlesticks with long wicks) often signal rejections of supply or demand zones.
Why Supply and Demand Trading Works
It is all about the psychology of the market. When the price hits a supply zone, sellers think the asset is too high and start selling, and the price goes down. When the price hits a demand zone, buyers step in thinking the asset is too low and the price goes up.
This creates an imbalance in the market as the number of buyers and sellers becomes uneven. Traders can trade on these imbalances to get into trades in the direction of the price move. For example, when a supply zone is hit, a trader might short the asset and expect the price to go down.
It works in trending and range bound markets. In trending markets, you trade with the trend, in range bound markets, zones trigger reversals.
How to Use Supply and Demand Zones When Trading Options
The supply and demand zone works for options too. Options traders can use these zones to place high probability trades, especially by buying calls at demand zones and put at supply zones.
For example, when price approaches a strong demand zone an options trader might buy a call, expecting the price to bounce. When price approaches a supply zone buying a put would be a trade to profit from the price drop.
Time decay is a big player in options trading and using supply and demand zones helps traders know when to get in. When combined with zone analysis traders can increase their chances of profit by timing their options trades better.
Supply and Demand vs. Other Strategies
Supply and demand trading is different from other strategies like moving averages or trendlines. Moving averages show the average price over a period of time, they lag behind price action. Supply and demand zones show real-time market conditions where buyers and sellers are placing orders.
One of the biggest advantages of the supply and demand zone is it can predict price reversals more accurately than lagging indicators. But it has its challenges. It takes experience to know strong zones and discipline to wait for the best setups.
You can combine supply and demand zones with other strategies for confirmation. Risk management is key and use stop loss and position size to limit your losses.
Common Mistakes
Even experienced traders can get it wrong with this strategy. Here are the common mistakes:
- One Time Frame Only: You need to look at multiple time frames to get a clear view of the market. Looking at just one can give you false signals.
- Misreading Weak Zones: Not all zones are created equal. Weak zones that don’t show a strong price reaction may not hold, and you will lose your trade.
- Ignoring Market News: Big economic events can affect supply and demand zones and cause prices to break through what seemed like a strong area. Always be aware of upcoming news that can affect your trades.
- Overtrading: Traders sometimes try to take every trade they see, but you should wait for the strongest setups and not trade just to be active in the market.
Real-Life Examples
Let’s look at a couple of real-life examples:
- Supply Zone Rejection: In a recent trade on EUR/USD, the price reached a strong supply zone after a rally. Several rejections at this level signaled a potential reversal. Traders who shorted at this zone saw a profitable decline in price over the following days.
- Demand Zone Support: On the S&P 500, a sharp drop was met with strong buying at a demand zone. Prices quickly rebounded, and traders who went long in this zone profited from the recovery.
The Role of Supply and Demand Zones in Different Market Conditions
Supply and demand zones behave differently depending on market conditions. In trending markets, zones provide entry points in the direction of the trend. In range-bound markets, they act as reversal points, where traders can enter trades in the opposite direction.
During high volatility, these zones may break more easily, while in low-volatility environments, they tend to hold more reliably. Seasonal patterns, such as earnings seasons or major economic events, can also affect the behaviour of these zones.
Key Tools and Resources
Several tools can help traders master S&D trading:
- Charting platforms like TradingView offer advanced features for marking zones.
- Volume analysis tools help confirm whether zones are strong.
- Trading journals allow traders to track their performance and refine their strategies over time.
Conclusion
Supply and demand trading provides a clear, logical framework for understanding price movements. By mastering this strategy, traders can improve their ability to predict reversals and spot profitable opportunities. Starting with a demo account can help traders gain experience and refine their skills before applying the strategy in live markets. Ultimately, combining supply and demand with other strategies can lead to more well-rounded and successful approaches.