Close Menu
My Forex View

    Subscribe to Updates

    Get the latest creative news from FooBar about art, design and business.

    Please enable JavaScript in your browser to complete this form.
    Loading
    What's Hot

    Technical Analysis – USDJPY tests 158.00 level for first time in five months

    December 27, 2024

    Daily Comment – Soft PCE inflation keeps rate cut hopes alive, but markets stay cautious

    December 23, 2024

    Technical Analysis – Gold returns above uptrend line

    December 23, 2024
    Facebook X (Twitter) Instagram
    • Live Market
    • Learn Forex Trading
    • Technical Analysis
    Facebook X (Twitter) Instagram Pinterest Vimeo
    My Forex ViewMy Forex View
    • Home
    • Live Market
      • GBPUSD
      • EURUSD
      • USDJPY
      • XAUUSD
      • All Currency Pair
      • All Commodities Pair
    • Analysis
    • Free Forex Signals
    • Education
    • Tools
      • Economic Calendar
      • Currency Converter
      • Risk of Ruin Calculator
      • Pivot Points Calculator
      • Crypto Exchange Fees Calculator
      • Fibonacci Calculator
      • Forex Rebates
      • Margin Calculator
      • Compounding Calculator
      • Profit Calculator
      • Pip Calculator
      • Lot Size Calculator
      • Drawdown Calculator
    • Blog
    Join Telegram
    My Forex View
    Home » Technical Analysis – AUDJPY in the red again
    AUDJPY

    Technical Analysis – AUDJPY in the red again

    Achilleas GeorgolopoulosBy Achilleas GeorgolopoulosOctober 8, 2024Updated:November 7, 2024No Comments2 Mins Read
    Facebook Twitter LinkedIn Pinterest Email
    • AUDJPY trades lower again, below the 200-day SMA
    • The bullish trend from the August 5 trough remains intact
    • Momentum indicators are getting close to sending bearish signals 

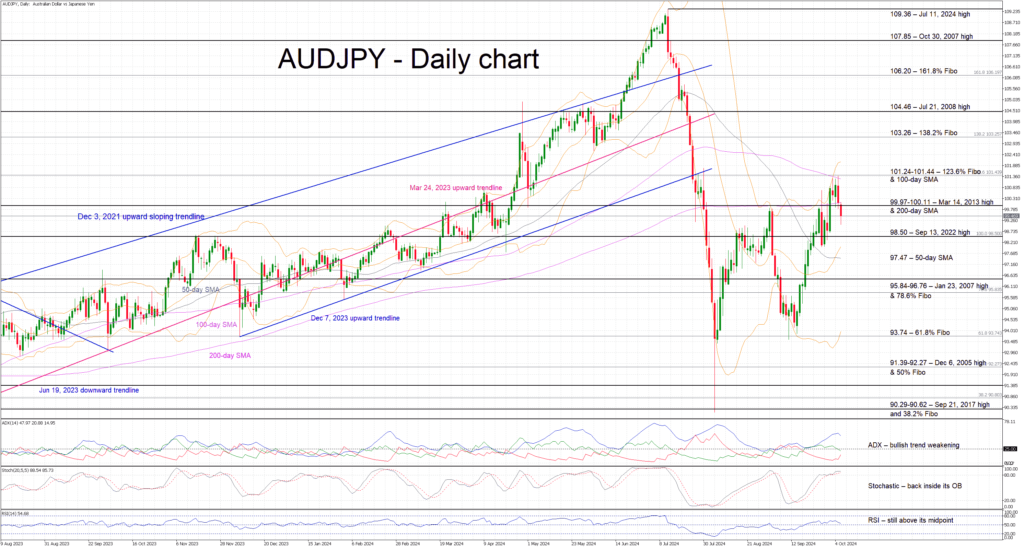
    AUDJPY is recording its second consecutive red candle today, dropping again below the 200-day simple moving average (SMA). However, it managed to register a higher high first, and hence the bullish trend, which is in place since the August 5 low and is characterized by a series of higher highs and higher lows, remains valid. In fact, the aussie is weaker today across the board as the minutes’ publication surprised by showing that the board discussed scenarios for lowering and raising interest rates.

    In the meantime, the momentum indicators are getting ready to turn bearish. In more detail, the Average Directional Movement Index (ADX) is edging lower thus pointing to a weakening bullish trend in AUDJPY. Similarly, the RSI is just a tad above its midpoint, revealing a weaker bullish pressure. Interestingly, the stochastic oscillator is comfortably hovering inside its overbought territory (OB). But it has failed up to now to mimic the AUDJPY’s price action and achieve a higher high, giving rise to a potential bearish divergence.

    Should the bears remain in control, they could try to keep AUDJPY below the 99.97-100.11 region and target the September 13, 2022, high at 98.50. The door could then be open for the 95.84-96.76 area, which is populated by the January 23, 2007, high and the 78.6% Fibonacci retracement level of the September 13, 2022 – March 24, 2023 down leg, provided that the 50-day SMA at 97.47 is easily overcome.

    On the other hand, should the bulls regain market control, they could try to lead AUDJPY back above the 99.97-100.11 area, which is defined by the March 14, 2013 high and the 200-day simple moving average (SMA). They could then stage a rally towards the 101.24-101.44 region and, if successful, be able to record a new higher high and gradually target the 103.26 level.

    To sum up, AUDJPY is in the red today, but the bears need to break some key support levels for the current short-term bullish trend to be challenged.

    Source by: XM Global

    Share. Facebook Twitter Pinterest LinkedIn Telegram WhatsApp Copy Link
    Previous ArticleTechnical Analysis – GBPUSD loses 3% from 2½-year high
    Next Article Technical Analysis – Gold bulls take a rest after rallying

    Related Posts

    Technical Analysis

    Technical Analysis – USDJPY tests 158.00 level for first time in five months

    December 27, 2024
    Gold

    Technical Analysis – Gold returns above uptrend line

    December 23, 2024
    Technical Analysis

    Technical Analysis – USDCHF bulls are back and want to stay

    December 13, 2024
    Top Posts

    Get a Free Xmaster Formula Indicator Forex for MT4

    July 30, 2024102 Views

    Technical Analysis – ETHUSD trades flat after ETF debut

    July 25, 202446 Views

    Traders Dynamic Index (TDI): Best Strategies and Settings

    August 16, 202438 Views
    Stay In Touch
    • Facebook
    • YouTube
    • TikTok
    • WhatsApp
    • Twitter
    • Instagram

    Subscribe to Updates

    Get the latest tech news from FooBar about tech, design and biz.

    Most Popular

    Get a Free Xmaster Formula Indicator Forex for MT4

    July 30, 2024102 Views

    Technical Analysis – ETHUSD trades flat after ETF debut

    July 25, 202446 Views

    Traders Dynamic Index (TDI): Best Strategies and Settings

    August 16, 202438 Views
    Our Picks

    Technical Analysis – USDJPY tests 158.00 level for first time in five months

    December 27, 2024

    Daily Comment – Soft PCE inflation keeps rate cut hopes alive, but markets stay cautious

    December 23, 2024

    Technical Analysis – Gold returns above uptrend line

    December 23, 2024

    Subscribe to Updates

    Get the latest creative news from FooBar about art, design and business.

    Please enable JavaScript in your browser to complete this form.
    Loading
    © 2025 MyForexView.
    • Home
    • Analysis
    • Economic Calendar

    Type above and press Enter to search. Press Esc to cancel.