Close Menu
My Forex View

    Subscribe to Updates

    Get the latest creative news from FooBar about art, design and business.

    Please enable JavaScript in your browser to complete this form.
    Loading
    What's Hot

    Technical Analysis – USDJPY tests 158.00 level for first time in five months

    December 27, 2024

    Daily Comment – Soft PCE inflation keeps rate cut hopes alive, but markets stay cautious

    December 23, 2024

    Technical Analysis – Gold returns above uptrend line

    December 23, 2024
    Facebook X (Twitter) Instagram
    • Live Market
    • Learn Forex Trading
    • Technical Analysis
    Facebook X (Twitter) Instagram Pinterest Vimeo
    My Forex ViewMy Forex View
    • Home
    • Live Market
      • GBPUSD
      • EURUSD
      • USDJPY
      • XAUUSD
      • All Currency Pair
      • All Commodities Pair
    • Analysis
    • Free Forex Signals
    • Education
    • Tools
      • Economic Calendar
      • Currency Converter
      • Risk of Ruin Calculator
      • Pivot Points Calculator
      • Crypto Exchange Fees Calculator
      • Fibonacci Calculator
      • Forex Rebates
      • Margin Calculator
      • Compounding Calculator
      • Profit Calculator
      • Pip Calculator
      • Lot Size Calculator
      • Drawdown Calculator
    • Blog
    Join Telegram
    My Forex View
    Home » Technical Analysis – AUDUSD rebound gets blocked by 50-day SMA
    AUDUSD

    Technical Analysis – AUDUSD rebound gets blocked by 50-day SMA

    Raffi BoyadjianBy Raffi BoyadjianAugust 15, 2024Updated:November 7, 2024No Comments2 Mins Read
    Facebook Twitter LinkedIn Pinterest Email
    • AUDUSD retraces 61.8% of the July-August selloff
    • But meets tough resistance at 50-day SMA

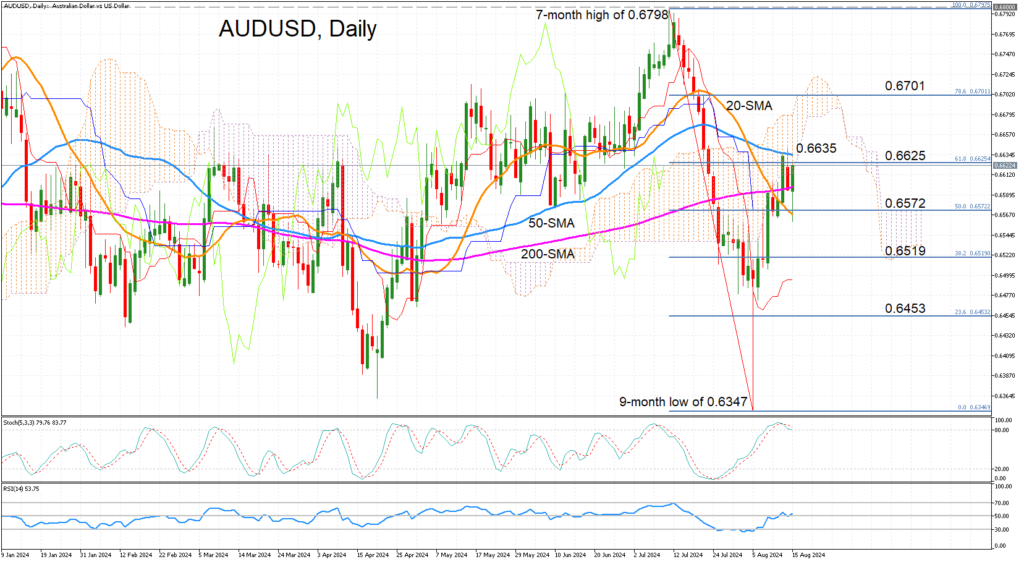
    AUDUSD has surged by around 4.5% from the August 5 low of 0.6347 but the recovery has hit a snag at the 50-day simple moving average (SMA) in the 0.6635 region. After two days of unsuccessful attempts to overcome this barrier, the price has now slipped below the 61.8% Fibonacci retracement of the July-August slump at 0.6625.

    The technical indicators remain positive but are sending mixed signals about the near-term price action. The stochastic oscillator is in the overbought region and trending lower, suggesting some losses could be on the cards. But the RSI is ticking up just above 50, signalling that the recovery has more to go.

    If the bulls manage to clear the 50-day SMA, the next key hurdle is likely to be the 0.6700 level, which corresponds with the 78.6% Fibonacci. Surpassing this would turn the focus to July’s seven-month high of 0.6798 when it came just shy of the 0.6800 mark.

    However, if the upswing runs out of steam, there’s likely to be some support at the 20-day SMA, which is slightly below the 50% Fibonacci of 0.6572. Slipping below this level could accelerate the declines towards the 38.2% Fibonacci of 0.6519.

    All in all, AUDUSD’s rebound seems secure for now, but a climb above the 50-day SMA is needed to shift the short-to-medium-term outlook to bullish, while a drop below the 20-day SMA could switch the pair back to bearish mode.

    Source by: XM Global

    Share. Facebook Twitter Pinterest LinkedIn Telegram WhatsApp Copy Link
    Previous ArticleMarket Comment – Stocks edge up in calm before the storm
    Next Article Market Comment – US retail sales eyed after CPI report fails to set off fireworks

    Related Posts

    Technical Analysis

    Technical Analysis – USDJPY tests 158.00 level for first time in five months

    December 27, 2024
    Gold

    Technical Analysis – Gold returns above uptrend line

    December 23, 2024
    Technical Analysis

    Technical Analysis – USDCHF bulls are back and want to stay

    December 13, 2024
    Top Posts

    Get a Free Xmaster Formula Indicator Forex for MT4

    July 30, 2024102 Views

    Technical Analysis – ETHUSD trades flat after ETF debut

    July 25, 202446 Views

    Traders Dynamic Index (TDI): Best Strategies and Settings

    August 16, 202438 Views
    Stay In Touch
    • Facebook
    • YouTube
    • TikTok
    • WhatsApp
    • Twitter
    • Instagram

    Subscribe to Updates

    Get the latest tech news from FooBar about tech, design and biz.

    Most Popular

    Get a Free Xmaster Formula Indicator Forex for MT4

    July 30, 2024102 Views

    Technical Analysis – ETHUSD trades flat after ETF debut

    July 25, 202446 Views

    Traders Dynamic Index (TDI): Best Strategies and Settings

    August 16, 202438 Views
    Our Picks

    Technical Analysis – USDJPY tests 158.00 level for first time in five months

    December 27, 2024

    Daily Comment – Soft PCE inflation keeps rate cut hopes alive, but markets stay cautious

    December 23, 2024

    Technical Analysis – Gold returns above uptrend line

    December 23, 2024

    Subscribe to Updates

    Get the latest creative news from FooBar about art, design and business.

    Please enable JavaScript in your browser to complete this form.
    Loading
    © 2025 MyForexView.
    • Home
    • Analysis
    • Economic Calendar

    Type above and press Enter to search. Press Esc to cancel.