Close Menu
My Forex View

    Subscribe to Updates

    Get the latest creative news from FooBar about art, design and business.

    Please enable JavaScript in your browser to complete this form.
    Loading
    What's Hot

    Technical Analysis – USDJPY tests 158.00 level for first time in five months

    December 27, 2024

    Daily Comment – Soft PCE inflation keeps rate cut hopes alive, but markets stay cautious

    December 23, 2024

    Technical Analysis – Gold returns above uptrend line

    December 23, 2024
    Facebook X (Twitter) Instagram
    • Live Market
    • Learn Forex Trading
    • Technical Analysis
    Facebook X (Twitter) Instagram Pinterest Vimeo
    My Forex ViewMy Forex View
    • Home
    • Live Market
      • GBPUSD
      • EURUSD
      • USDJPY
      • XAUUSD
      • All Currency Pair
      • All Commodities Pair
    • Analysis
    • Free Forex Signals
    • Education
    • Tools
      • Economic Calendar
      • Currency Converter
      • Risk of Ruin Calculator
      • Pivot Points Calculator
      • Crypto Exchange Fees Calculator
      • Fibonacci Calculator
      • Forex Rebates
      • Margin Calculator
      • Compounding Calculator
      • Profit Calculator
      • Pip Calculator
      • Lot Size Calculator
      • Drawdown Calculator
    • Blog
    Join Telegram
    My Forex View
    Home » Technical Analysis – AUDUSD trapped in a bearish formation
    AUDUSD

    Technical Analysis – AUDUSD trapped in a bearish formation

    Christina ParthenidouBy Christina ParthenidouDecember 3, 2024No Comments2 Mins Read
    Facebook Twitter LinkedIn Pinterest Email
    • AUDUSD struggles below 20-SMA; trend signals are discouraging
    • AZ Q3 GDP could be a market mover on Wednesday at 00:30 GMT


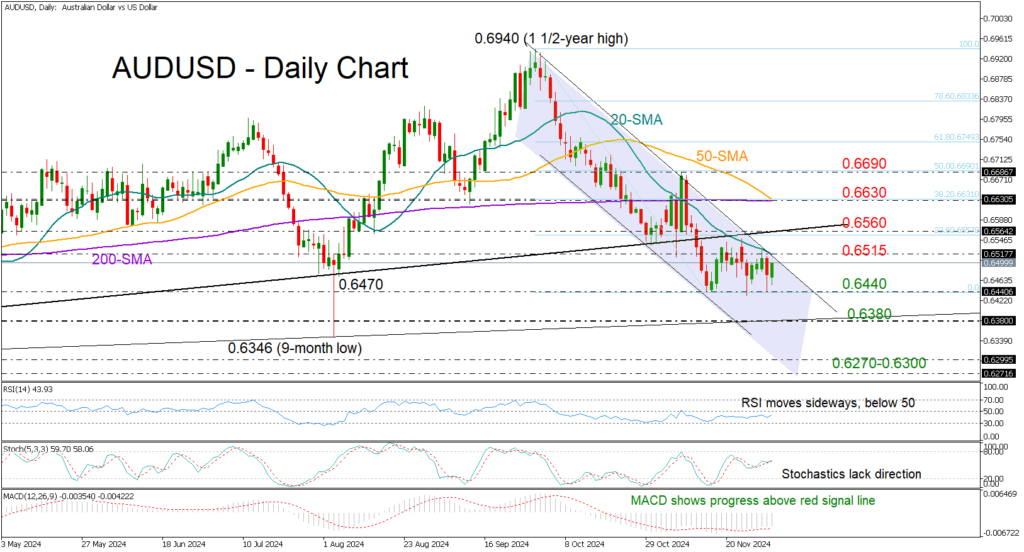
    AUDUSD kicked off the week on a weak note, failing to break above its 20-day simple moving average (SMA) for the second time, with losses capped near its recent low of around 0.6440.

    The pair is consolidating at the bottom of a two-month downtrend, and a bearish breakout remains possible as the 50-day and 200-day SMAs form a “death cross.”

    The technical signals, however, are mixed. Hence, traders may stay on the sidelines until they see a decisive close above 0.6515 or below 0.6440. If the bearish scenario plays out, immediate support could come from the 2022 support trendline at 0.6380, a break of which could squeeze the price toward the 0.6270-0.6300 constraining zone.

    In the bullish case that the pair accelerates above 0.6515, resistance could instantly occur near the former support trendline from 2023 at 0.6560. A successful move higher could target the 50- and 200-day SMAs at 0.6630 and then November’s high around 0.6690. Additional gains from there would signal a bullish trend reversal in the short-term picture.

    In brief, AUDUSD remains exposed to downside risks as its ongoing consolidation phase is developing within a bearish formation. A clear step below 0.6440 could motivate more selling, particularly if the 0.6380 support cracks too.

    Share. Facebook Twitter Pinterest LinkedIn Telegram WhatsApp Copy Link
    Previous ArticleTechnical Analysis – EURJPY rebounds off more-than 2-month low
    Next Article Technical Analysis – Gold could see further weakness

    Related Posts

    Technical Analysis

    Technical Analysis – USDJPY tests 158.00 level for first time in five months

    December 27, 2024
    Gold

    Technical Analysis – Gold returns above uptrend line

    December 23, 2024
    Technical Analysis

    Technical Analysis – USDCHF bulls are back and want to stay

    December 13, 2024
    Top Posts

    Get a Free Xmaster Formula Indicator Forex for MT4

    July 30, 2024102 Views

    Technical Analysis – ETHUSD trades flat after ETF debut

    July 25, 202446 Views

    Traders Dynamic Index (TDI): Best Strategies and Settings

    August 16, 202438 Views
    Stay In Touch
    • Facebook
    • YouTube
    • TikTok
    • WhatsApp
    • Twitter
    • Instagram

    Subscribe to Updates

    Get the latest tech news from FooBar about tech, design and biz.

    Most Popular

    Get a Free Xmaster Formula Indicator Forex for MT4

    July 30, 2024102 Views

    Technical Analysis – ETHUSD trades flat after ETF debut

    July 25, 202446 Views

    Traders Dynamic Index (TDI): Best Strategies and Settings

    August 16, 202438 Views
    Our Picks

    Technical Analysis – USDJPY tests 158.00 level for first time in five months

    December 27, 2024

    Daily Comment – Soft PCE inflation keeps rate cut hopes alive, but markets stay cautious

    December 23, 2024

    Technical Analysis – Gold returns above uptrend line

    December 23, 2024

    Subscribe to Updates

    Get the latest creative news from FooBar about art, design and business.

    Please enable JavaScript in your browser to complete this form.
    Loading
    © 2025 MyForexView.
    • Home
    • Analysis
    • Economic Calendar

    Type above and press Enter to search. Press Esc to cancel.