Close Menu
My Forex View

    Subscribe to Updates

    Get the latest creative news from FooBar about art, design and business.

    Please enable JavaScript in your browser to complete this form.
    Loading
    What's Hot

    Technical Analysis – USDJPY tests 158.00 level for first time in five months

    December 27, 2024

    Daily Comment – Soft PCE inflation keeps rate cut hopes alive, but markets stay cautious

    December 23, 2024

    Technical Analysis – Gold returns above uptrend line

    December 23, 2024
    Facebook X (Twitter) Instagram
    • Live Market
    • Learn Forex Trading
    • Technical Analysis
    Facebook X (Twitter) Instagram Pinterest Vimeo
    My Forex ViewMy Forex View
    • Home
    • Live Market
      • GBPUSD
      • EURUSD
      • USDJPY
      • XAUUSD
      • All Currency Pair
      • All Commodities Pair
    • Analysis
    • Free Forex Signals
    • Education
    • Tools
      • Economic Calendar
      • Currency Converter
      • Risk of Ruin Calculator
      • Pivot Points Calculator
      • Crypto Exchange Fees Calculator
      • Fibonacci Calculator
      • Forex Rebates
      • Margin Calculator
      • Compounding Calculator
      • Profit Calculator
      • Pip Calculator
      • Lot Size Calculator
      • Drawdown Calculator
    • Blog
    Join Telegram
    My Forex View
    Home » Technical Analysis – Bitcoin slides and hits the 56,200 support
    BTCUSD

    Technical Analysis – Bitcoin slides and hits the 56,200 support

    Charalampos PissourosBy Charalampos PissourosSeptember 5, 2024Updated:November 7, 2024No Comments2 Mins Read
    Facebook Twitter LinkedIn Pinterest Email
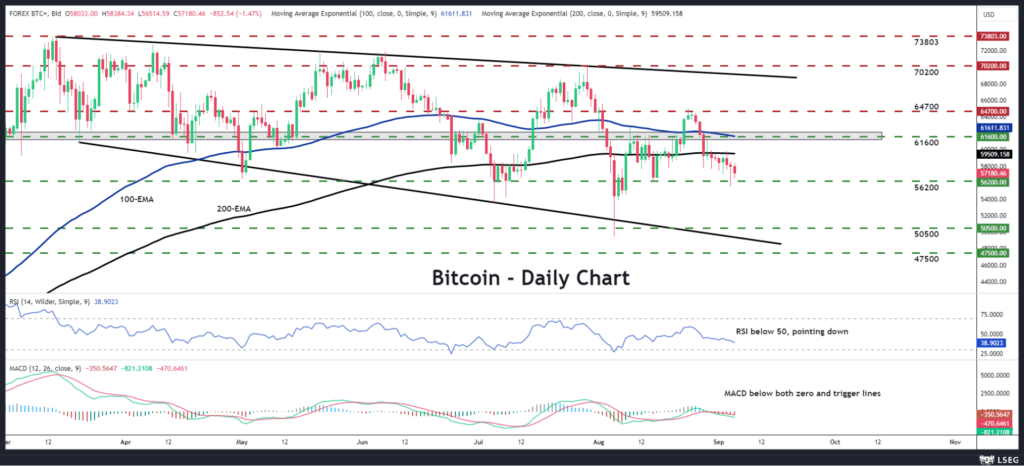
    • Bitcoin has been declining since August 26
    • The bigger picture points to a broadening formation
    • Oscillators imply further declines within the pattern

    BTCUSD has been sliding lately, after hitting resistance near the 64,700 zone on August 24 and 26. The crypto king dropped below the key support (now turned into resistance) zone of 61,600 and found support slightly below 56,200 yesterday. In the bigger picture, bitcoin has been trading within a broadening formation since March 13, implying a neutral medium-term outlook.

    The short-term oscillators are detecting bearish momentum, suggesting that some further declines may be possible. The RSI is lying below the 50 equilibrium line, pointing down, while the MACD is running below both its zero and trigger lines.

    If the bears are willing to stay in the driver’s seat and push the action below 56,200, they may decide to take the battle all the way down to the 50,500 zone. However, there could still be a chance for a strong rebound from there, as the price would still be within the aforementioned broadening pattern.

    On the upside, a return above 61,600 could aim for the 64,700 zone, where a break would confirm a higher high and pave the way towards the upper bound of the broadening formation or the 70,700 zone. If the bulls do not stop there, a break higher could see scope for extensions towards the record high of 73,803, hit on March 14.

    To recap, bitcoin has been sliding lately, but with the price action remaining within a broadening pattern. Even if further declines occur, as long as the formation stays intact, the broader outlook could be considered neutral.

    Source by: XM Global

    Share. Facebook Twitter Pinterest LinkedIn Telegram WhatsApp Copy Link
    Previous ArticleTechnical Analysis – GBPJPY continues selling interest below 190.00
    Next Article Technical Analysis – USDCHF eyes August’s low as bears stay in charge

    Related Posts

    Technical Analysis

    Technical Analysis – USDJPY tests 158.00 level for first time in five months

    December 27, 2024
    Gold

    Technical Analysis – Gold returns above uptrend line

    December 23, 2024
    Technical Analysis

    Technical Analysis – USDCHF bulls are back and want to stay

    December 13, 2024
    Top Posts

    Get a Free Xmaster Formula Indicator Forex for MT4

    July 30, 2024102 Views

    Technical Analysis – ETHUSD trades flat after ETF debut

    July 25, 202446 Views

    Traders Dynamic Index (TDI): Best Strategies and Settings

    August 16, 202438 Views
    Stay In Touch
    • Facebook
    • YouTube
    • TikTok
    • WhatsApp
    • Twitter
    • Instagram

    Subscribe to Updates

    Get the latest tech news from FooBar about tech, design and biz.

    Most Popular

    Get a Free Xmaster Formula Indicator Forex for MT4

    July 30, 2024102 Views

    Technical Analysis – ETHUSD trades flat after ETF debut

    July 25, 202446 Views

    Traders Dynamic Index (TDI): Best Strategies and Settings

    August 16, 202438 Views
    Our Picks

    Technical Analysis – USDJPY tests 158.00 level for first time in five months

    December 27, 2024

    Daily Comment – Soft PCE inflation keeps rate cut hopes alive, but markets stay cautious

    December 23, 2024

    Technical Analysis – Gold returns above uptrend line

    December 23, 2024

    Subscribe to Updates

    Get the latest creative news from FooBar about art, design and business.

    Please enable JavaScript in your browser to complete this form.
    Loading
    © 2025 MyForexView.
    • Home
    • Analysis
    • Economic Calendar

    Type above and press Enter to search. Press Esc to cancel.