Close Menu
My Forex View

    Subscribe to Updates

    Get the latest creative news from FooBar about art, design and business.

    Please enable JavaScript in your browser to complete this form.
    Loading
    What's Hot

    Technical Analysis – USDJPY tests 158.00 level for first time in five months

    December 27, 2024

    Daily Comment – Soft PCE inflation keeps rate cut hopes alive, but markets stay cautious

    December 23, 2024

    Technical Analysis – Gold returns above uptrend line

    December 23, 2024
    Facebook X (Twitter) Instagram
    • Live Market
    • Learn Forex Trading
    • Technical Analysis
    Facebook X (Twitter) Instagram Pinterest Vimeo
    My Forex ViewMy Forex View
    • Home
    • Live Market
      • GBPUSD
      • EURUSD
      • USDJPY
      • XAUUSD
      • All Currency Pair
      • All Commodities Pair
    • Analysis
    • Free Forex Signals
    • Education
    • Tools
      • Economic Calendar
      • Currency Converter
      • Risk of Ruin Calculator
      • Pivot Points Calculator
      • Crypto Exchange Fees Calculator
      • Fibonacci Calculator
      • Forex Rebates
      • Margin Calculator
      • Compounding Calculator
      • Profit Calculator
      • Pip Calculator
      • Lot Size Calculator
      • Drawdown Calculator
    • Blog
    Join Telegram
    My Forex View
    Home » Technical Analysis – Could the AUDUSD selloff pause temporarily?
    AUDUSD

    Technical Analysis – Could the AUDUSD selloff pause temporarily?

    Achilleas GeorgolopoulosBy Achilleas GeorgolopoulosOctober 31, 2024Updated:November 7, 2024No Comments2 Mins Read
    Facebook Twitter LinkedIn Pinterest Email
    • AUDUSD is trading sideways, a tad above 0.6547
    • The downtrend from the September 30 high remains in place
    • Momentum indicators are mostly bearish

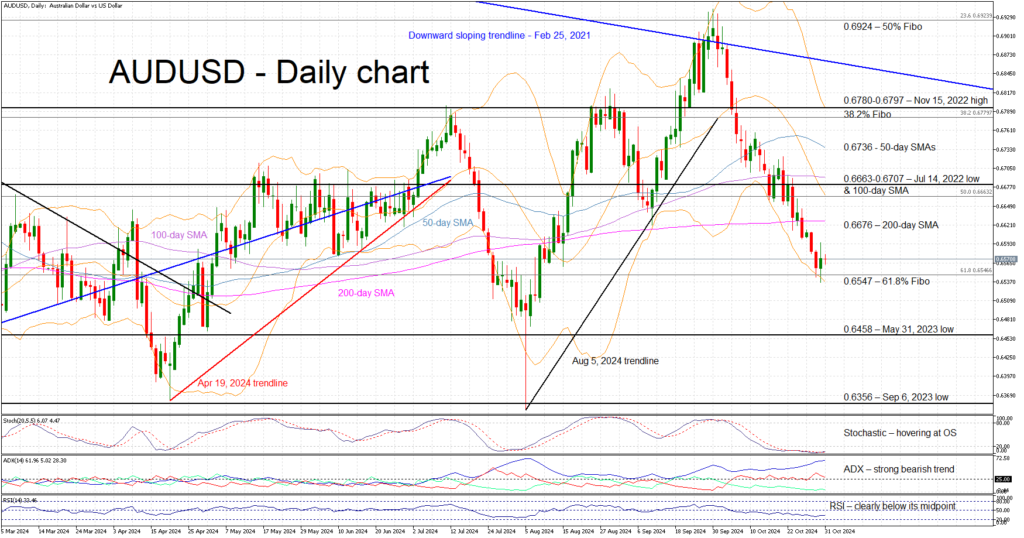
    AUDUSD is trading sideways today, a tad above 0.6547. The bearish trend from the September 30 peak remains firmly in place, and, quite interestingly, AUDUSD bulls have failed, up to now, to stage an upleg and temporarily interrupt the ongoing selloff. The market’s focus is on the US presidential election although this week’s US data could also materially impact the dollar’s performance.

    The momentum indicators are bearish at this juncture. In more detail, the Average Directional Movement Index (ADX) is edging higher and thus signalling a strong bearish trend in AUDUSD, while the RSI is comfortably trading below its 50-midpoint. Interestingly, the stochastic oscillator is hovering inside its oversold territory (OS), but it has failed, up to now, to climb above its moving average (MA). A move above both its MA and OS could be the signal the bulls have been waiting for in order to finally stage a small rally.

    Should the bears remain hungry, they could try to break below the 61.8% Fibonacci retracement level of the October 13, 2022 – February 2, 2023 uptrend at 0.6547. The door could then open for a move towards the March 31, 2023 low at 0.6458, with the next plausible target being the September 6, 2023, low at 0.6536.

    On the other hand, the bulls are desperate for a small upleg. They could first try to keep AUDUSD above the 0.6547 level and then gradually push it higher towards the 200-day simple moving average (SMA) at 0.6676. If successful, they could then test the resistance set by the busier 0.6663-0.6707 area, which is populated by the July 14, 2022 low and the 100-day SMA.

    To sum up, AUDUSD bears remain in control and potentially in a strong position for next big US events starting with Friday’s job report. 

    Source by: XM Global

    Share. Facebook Twitter Pinterest LinkedIn Telegram WhatsApp Copy Link
    Previous ArticleTechnical Analysis – EURUSD halts decline but downside risks persist
    Next Article Technical Analysis – WTI crude oil recoups bearish gap

    Related Posts

    Technical Analysis

    Technical Analysis – USDJPY tests 158.00 level for first time in five months

    December 27, 2024
    Gold

    Technical Analysis – Gold returns above uptrend line

    December 23, 2024
    Technical Analysis

    Technical Analysis – USDCHF bulls are back and want to stay

    December 13, 2024
    Top Posts

    Get a Free Xmaster Formula Indicator Forex for MT4

    July 30, 2024102 Views

    Technical Analysis – ETHUSD trades flat after ETF debut

    July 25, 202446 Views

    Traders Dynamic Index (TDI): Best Strategies and Settings

    August 16, 202438 Views
    Stay In Touch
    • Facebook
    • YouTube
    • TikTok
    • WhatsApp
    • Twitter
    • Instagram

    Subscribe to Updates

    Get the latest tech news from FooBar about tech, design and biz.

    Most Popular

    Get a Free Xmaster Formula Indicator Forex for MT4

    July 30, 2024102 Views

    Technical Analysis – ETHUSD trades flat after ETF debut

    July 25, 202446 Views

    Traders Dynamic Index (TDI): Best Strategies and Settings

    August 16, 202438 Views
    Our Picks

    Technical Analysis – USDJPY tests 158.00 level for first time in five months

    December 27, 2024

    Daily Comment – Soft PCE inflation keeps rate cut hopes alive, but markets stay cautious

    December 23, 2024

    Technical Analysis – Gold returns above uptrend line

    December 23, 2024

    Subscribe to Updates

    Get the latest creative news from FooBar about art, design and business.

    Please enable JavaScript in your browser to complete this form.
    Loading
    © 2025 MyForexView.
    • Home
    • Analysis
    • Economic Calendar

    Type above and press Enter to search. Press Esc to cancel.