Close Menu
My Forex View

    Subscribe to Updates

    Get the latest creative news from FooBar about art, design and business.

    Please enable JavaScript in your browser to complete this form.
    Loading
    What's Hot

    Technical Analysis – USDJPY tests 158.00 level for first time in five months

    December 27, 2024

    Daily Comment – Soft PCE inflation keeps rate cut hopes alive, but markets stay cautious

    December 23, 2024

    Technical Analysis – Gold returns above uptrend line

    December 23, 2024
    Facebook X (Twitter) Instagram
    • Live Market
    • Learn Forex Trading
    • Technical Analysis
    Facebook X (Twitter) Instagram Pinterest Vimeo
    My Forex ViewMy Forex View
    • Home
    • Live Market
      • GBPUSD
      • EURUSD
      • USDJPY
      • XAUUSD
      • All Currency Pair
      • All Commodities Pair
    • Analysis
    • Free Forex Signals
    • Education
    • Tools
      • Economic Calendar
      • Currency Converter
      • Risk of Ruin Calculator
      • Pivot Points Calculator
      • Crypto Exchange Fees Calculator
      • Fibonacci Calculator
      • Forex Rebates
      • Margin Calculator
      • Compounding Calculator
      • Profit Calculator
      • Pip Calculator
      • Lot Size Calculator
      • Drawdown Calculator
    • Blog
    Join Telegram
    My Forex View
    Home » Technical Analysis – Does the recent EURJPY correction have legs?
    EURJPY

    Technical Analysis – Does the recent EURJPY correction have legs?

    Achilleas GeorgolopoulosBy Achilleas GeorgolopoulosAugust 8, 2024Updated:November 7, 2024No Comments2 Mins Read
    Facebook Twitter LinkedIn Pinterest Email
    • EURJPY is hovering around the 159.64 level
    • It is trading around 9% lower from its recent high
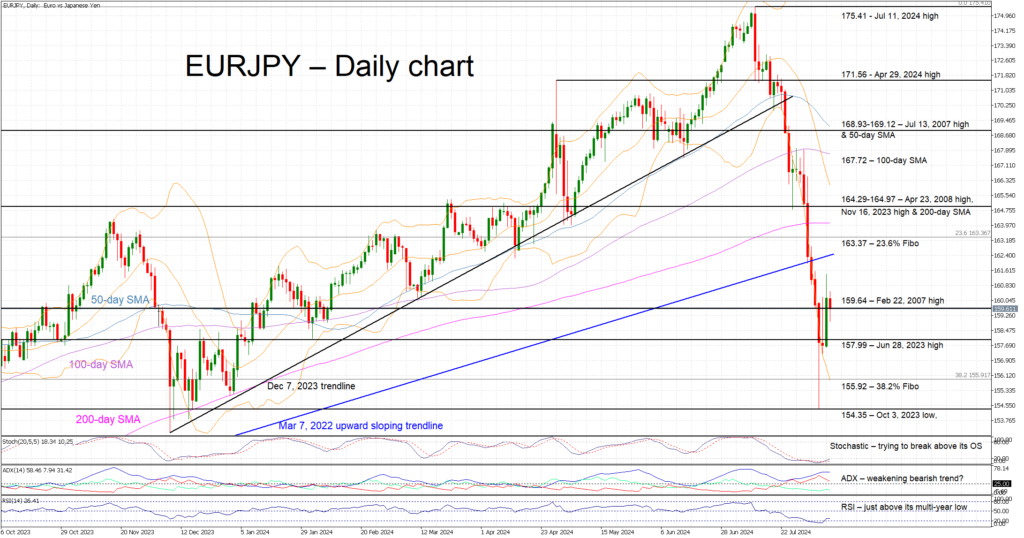
    • Momentum indicators are mixed, and all eyes are on stochastics

    EURJPY is trading lower today, close to the 159.64 level and considerably above the August 5 low of 154.38. The market is clearly trying to find its footing following the recent rout that was triggered by the bigger-than-expected rate hike by the BoJ and fears about an imminent US recession. JPY was the primary beneficiary of this acute market reaction with EURJPY dropping around 9% from the all-time high of 175.41.

    In the meantime, momentum indicators are mostly mixed. More specifically, the RSI is edging higher, but remains very close to its multi-year low. Similarly, the Average Directional Movement Index (ADX) is moving sideways, potentially signaling a weakening bearish trend in EURJPY. More importantly, the stochastic oscillator has surpassed its moving average, and it is preparing to cross above its oversold territory (OS). Should this move take place, it could be seen as a strong bullish signal.

    Should the bulls remain confident, they would try to keep EURJPY above the February 22, 2007 high at 159.64 and then gradually stage a rally towards the 23.6% Fibonacci retracement level of March 7, 2022 – July 11, 2024 downtrend at 163.37. The next key resistance area could then come at the busy 164.29-164.97 region.

    On the other hand, should the bears remain hungry, they would try to break below 159.64 and then push EURJPY towards the June 28, 2023 high at 157.99. If successful, they could then test the support set by the 38.2% Fibonacci retracement level at 155.92, a tad above the 2024 low of 154.38.

    To sum up, the bulls are trying to recover part of their strong losses but EURJPY’s correction might still have legs.

    Source by: XM Global

    Share. Facebook Twitter Pinterest LinkedIn Telegram WhatsApp Copy Link
    Previous ArticleTechnical Analysis – NZDUSD jumps aggressively higher
    Next Article Market Comment – BoJ Summary of Opinions reveals hawkish mood

    Related Posts

    Technical Analysis

    Technical Analysis – USDJPY tests 158.00 level for first time in five months

    December 27, 2024
    Gold

    Technical Analysis – Gold returns above uptrend line

    December 23, 2024
    Technical Analysis

    Technical Analysis – USDCHF bulls are back and want to stay

    December 13, 2024
    Top Posts

    Get a Free Xmaster Formula Indicator Forex for MT4

    July 30, 2024105 Views

    Technical Analysis – ETHUSD trades flat after ETF debut

    July 25, 202448 Views

    Traders Dynamic Index (TDI): Best Strategies and Settings

    August 16, 202444 Views
    Stay In Touch
    • Facebook
    • YouTube
    • TikTok
    • WhatsApp
    • Twitter
    • Instagram

    Subscribe to Updates

    Get the latest tech news from FooBar about tech, design and biz.

    Most Popular

    Get a Free Xmaster Formula Indicator Forex for MT4

    July 30, 2024105 Views

    Technical Analysis – ETHUSD trades flat after ETF debut

    July 25, 202448 Views

    Traders Dynamic Index (TDI): Best Strategies and Settings

    August 16, 202444 Views
    Our Picks

    Technical Analysis – USDJPY tests 158.00 level for first time in five months

    December 27, 2024

    Daily Comment – Soft PCE inflation keeps rate cut hopes alive, but markets stay cautious

    December 23, 2024

    Technical Analysis – Gold returns above uptrend line

    December 23, 2024

    Subscribe to Updates

    Get the latest creative news from FooBar about art, design and business.

    Please enable JavaScript in your browser to complete this form.
    Loading
    © 2025 MyForexView.
    • Home
    • Analysis
    • Economic Calendar

    Type above and press Enter to search. Press Esc to cancel.