Close Menu
My Forex View

    Subscribe to Updates

    Get the latest creative news from FooBar about art, design and business.

    Please enable JavaScript in your browser to complete this form.
    Loading
    What's Hot

    Technical Analysis – USDJPY tests 158.00 level for first time in five months

    December 27, 2024

    Daily Comment – Soft PCE inflation keeps rate cut hopes alive, but markets stay cautious

    December 23, 2024

    Technical Analysis – Gold returns above uptrend line

    December 23, 2024
    Facebook X (Twitter) Instagram
    • Live Market
    • Learn Forex Trading
    • Technical Analysis
    Facebook X (Twitter) Instagram Pinterest Vimeo
    My Forex ViewMy Forex View
    • Home
    • Live Market
      • GBPUSD
      • EURUSD
      • USDJPY
      • XAUUSD
      • All Currency Pair
      • All Commodities Pair
    • Analysis
    • Free Forex Signals
    • Education
    • Tools
      • Economic Calendar
      • Currency Converter
      • Risk of Ruin Calculator
      • Pivot Points Calculator
      • Crypto Exchange Fees Calculator
      • Fibonacci Calculator
      • Forex Rebates
      • Margin Calculator
      • Compounding Calculator
      • Profit Calculator
      • Pip Calculator
      • Lot Size Calculator
      • Drawdown Calculator
    • Blog
    Join Telegram
    My Forex View
    Home » Technical Analysis – EURCHF bulls crave an upward move
    EURCHF

    Technical Analysis – EURCHF bulls crave an upward move

    Achilleas GeorgolopoulosBy Achilleas GeorgolopoulosNovember 7, 2024Updated:November 7, 2024No Comments2 Mins Read
    Facebook Twitter LinkedIn Pinterest Email
    • EURCHF trades in a tight range
    • The medium-term bearish trend is still valid
    • Momentum indicators prepare for the next leg 

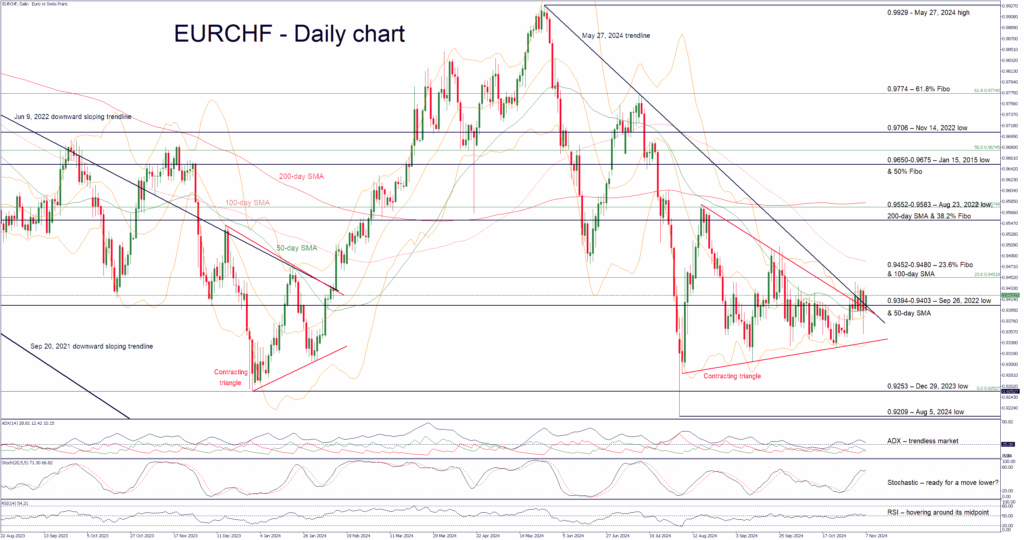
    EURCHF is edging higher today, testing the resistance set by both the 0.9394-0.9403 area and the May 27, 2024 downward slopping trendline. EURCHF has been trading in a tight range over the past few sessions, inside the developing contracting triangle pattern, as the bulls have failed to materially benefit from a barrage of positive euro area data.

    This reduced volatility is reflected in the momentum indicators, which remain mostly directionless. In more detail, the RSI continues to aimlessly hover around its midpoint, without any desire for a more forceful move. Similarly, the Average Directional Movement Index (ADX) is dropping towards its midpoint and thus points to a trendless market in EURCHF.

    More importantly, the stochastic oscillator is preparing to test the support set by its moving average (MA). A bounce higher could reveal a buildup of bullish pressure in EURCHF, while a break below its MA could open the door to a sizeable downleg in EURCHF.

    If the bulls remain confident, they will try to push EURCHF above the busy 0.9394-0.9403 area, which is populated by the September 26, 2022 low, the 50-day simple moving average (SMA), the May 27, 2024 descending trendline and upper boundary of the contracting triangle. A move above the 0.9452-0.9480 region could validate the bullish breakout with the next resistance expected at the key 0.9552-0.9583 area.

    On the flip side, the bears are trying to protect the May 27, 2024 trendline and push EURCHF back inside the contracting triangle. They could then stage a selloff towards the lower boundary of this pattern, aiming to finally record a bearish breakout that spans over the next few sessions. If successful, the bears could then have the chance to target the December 29, 2023 low at 0.9253.

    To sum up, EURCHF bulls are trying to break the current range trading and stage a bullish breakout towards the 0.9452-0.9480 area.

    Source by: XM Global

    Share. Facebook Twitter Pinterest LinkedIn Telegram WhatsApp Copy Link
    Previous ArticleDaily Comment – Dollar and stocks surge on Trump victory bets
    Next Article Technical Analysis – EURUSD creates negative gap near 1.0700

    Related Posts

    Technical Analysis

    Technical Analysis – USDJPY tests 158.00 level for first time in five months

    December 27, 2024
    Gold

    Technical Analysis – Gold returns above uptrend line

    December 23, 2024
    Technical Analysis

    Technical Analysis – USDCHF bulls are back and want to stay

    December 13, 2024
    Top Posts

    Get a Free Xmaster Formula Indicator Forex for MT4

    July 30, 2024102 Views

    Technical Analysis – ETHUSD trades flat after ETF debut

    July 25, 202446 Views

    Traders Dynamic Index (TDI): Best Strategies and Settings

    August 16, 202438 Views
    Stay In Touch
    • Facebook
    • YouTube
    • TikTok
    • WhatsApp
    • Twitter
    • Instagram

    Subscribe to Updates

    Get the latest tech news from FooBar about tech, design and biz.

    Most Popular

    Get a Free Xmaster Formula Indicator Forex for MT4

    July 30, 2024102 Views

    Technical Analysis – ETHUSD trades flat after ETF debut

    July 25, 202446 Views

    Traders Dynamic Index (TDI): Best Strategies and Settings

    August 16, 202438 Views
    Our Picks

    Technical Analysis – USDJPY tests 158.00 level for first time in five months

    December 27, 2024

    Daily Comment – Soft PCE inflation keeps rate cut hopes alive, but markets stay cautious

    December 23, 2024

    Technical Analysis – Gold returns above uptrend line

    December 23, 2024

    Subscribe to Updates

    Get the latest creative news from FooBar about art, design and business.

    Please enable JavaScript in your browser to complete this form.
    Loading
    © 2025 MyForexView.
    • Home
    • Analysis
    • Economic Calendar

    Type above and press Enter to search. Press Esc to cancel.