Close Menu
My Forex View

    Subscribe to Updates

    Get the latest creative news from FooBar about art, design and business.

    Please enable JavaScript in your browser to complete this form.
    Loading
    What's Hot

    Technical Analysis – USDJPY tests 158.00 level for first time in five months

    December 27, 2024

    Daily Comment – Soft PCE inflation keeps rate cut hopes alive, but markets stay cautious

    December 23, 2024

    Technical Analysis – Gold returns above uptrend line

    December 23, 2024
    Facebook X (Twitter) Instagram
    • Live Market
    • Learn Forex Trading
    • Technical Analysis
    Facebook X (Twitter) Instagram Pinterest Vimeo
    My Forex ViewMy Forex View
    • Home
    • Live Market
      • GBPUSD
      • EURUSD
      • USDJPY
      • XAUUSD
      • All Currency Pair
      • All Commodities Pair
    • Analysis
    • Free Forex Signals
    • Education
    • Tools
      • Economic Calendar
      • Currency Converter
      • Risk of Ruin Calculator
      • Pivot Points Calculator
      • Crypto Exchange Fees Calculator
      • Fibonacci Calculator
      • Forex Rebates
      • Margin Calculator
      • Compounding Calculator
      • Profit Calculator
      • Pip Calculator
      • Lot Size Calculator
      • Drawdown Calculator
    • Blog
    Join Telegram
    My Forex View
    Home » Technical Analysis – EURCHF trades higher, inside a developing pattern
    EURCHF

    Technical Analysis – EURCHF trades higher, inside a developing pattern

    Achilleas GeorgolopoulosBy Achilleas GeorgolopoulosSeptember 30, 2024Updated:November 7, 2024No Comments2 Mins Read
    Facebook Twitter LinkedIn Pinterest Email
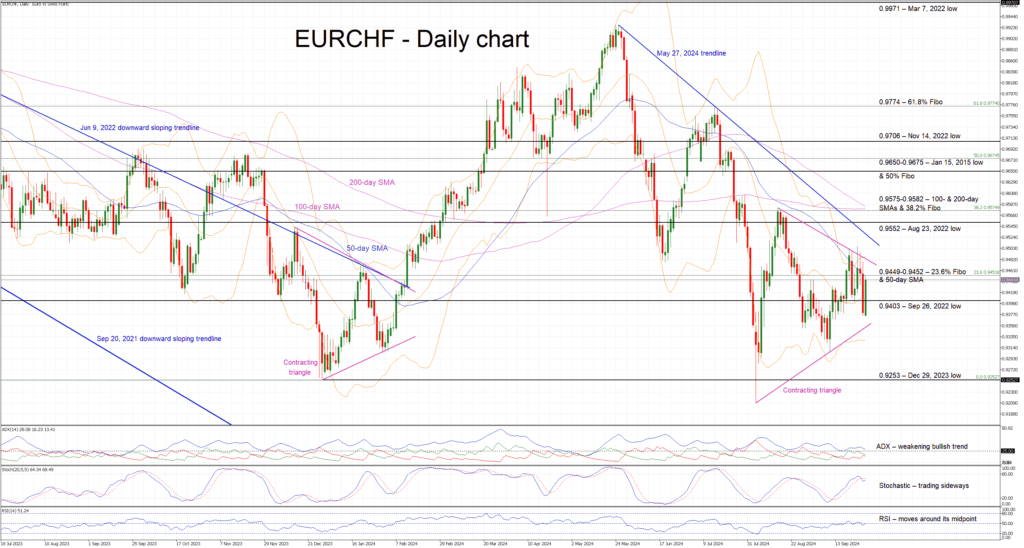
    • EURCHF is in the green today, a tad below its 50-day SMA
    • The prevailing downward trend is still firmly in place
    • Momentum indicators are inconclusive at this stage

    EURCHF is trading higher, above the September 26, 2022 low at 0.9403 but a tad below the 50-day simple moving average (SMA). The bearish trend from the May 27, 2024 peak remains in place and has yet to be challenged. However, a contracting triangle is developing, and it is characterized by a series of lower highs and higher lows, with EURCHF progressively trading into smaller ranges.

    In the meantime, the momentum indicators are mixed. In more detail, the RSI continues to aimlessly hover around its midpoint, while the Average Directional Movement Index (ADX) is edging lower and potentially signaling the end of the recent bullish trend in EURCHF. More importantly, the stochastic oscillator has dropped below its moving average, but it appears unable to stage a strong downward move. Interestingly, a bearish divergence is present and could hence play a key role in the next leg in EURCHF.

    Should the bulls remain confident, they will try to push EURCHF above the 0.9449-0.9452 area, which is populated by the 50-day SMA and the 23.6% Fibonacci retracement of the January 13, 2023 – December 29, 2023 downtrend. They could then test the resistance set by both the upper trendline of the contracting triangle and the May 27, 2024 trendline. If successful, the door could then open to a move towards the August 23, 2022 low at 0.9552 and, more importantly, the busy 0.9575-0.9582 area.

    On the flip side, the bears are trying to maintain their sizeable gains. They could try to keep EURCHF below the 0.9449-0.9452 region and gradually push it towards the September 26, 2022 low at 0.9403. Even lower, the path looks obstacle-free until the December 29, 2023 low at 0.9253, provided that the triangle’s lower trendline is successfully broken.

    To sum up, EURCHF bulls are trying to maintain the recent bullish momentum, but the next leg in EURCHF could occur in either direction.

    Source by: XM Global

    Share. Facebook Twitter Pinterest LinkedIn Telegram WhatsApp Copy Link
    Previous ArticleWeekly Technical Outlook – USDJPY, EURUSD, AUDUSD
    Next Article Technical Analysis – US 500 calms down after hitting new record high

    Related Posts

    Technical Analysis

    Technical Analysis – USDJPY tests 158.00 level for first time in five months

    December 27, 2024
    Gold

    Technical Analysis – Gold returns above uptrend line

    December 23, 2024
    Technical Analysis

    Technical Analysis – USDCHF bulls are back and want to stay

    December 13, 2024
    Top Posts

    Get a Free Xmaster Formula Indicator Forex for MT4

    July 30, 2024102 Views

    Technical Analysis – ETHUSD trades flat after ETF debut

    July 25, 202446 Views

    Traders Dynamic Index (TDI): Best Strategies and Settings

    August 16, 202438 Views
    Stay In Touch
    • Facebook
    • YouTube
    • TikTok
    • WhatsApp
    • Twitter
    • Instagram

    Subscribe to Updates

    Get the latest tech news from FooBar about tech, design and biz.

    Most Popular

    Get a Free Xmaster Formula Indicator Forex for MT4

    July 30, 2024102 Views

    Technical Analysis – ETHUSD trades flat after ETF debut

    July 25, 202446 Views

    Traders Dynamic Index (TDI): Best Strategies and Settings

    August 16, 202438 Views
    Our Picks

    Technical Analysis – USDJPY tests 158.00 level for first time in five months

    December 27, 2024

    Daily Comment – Soft PCE inflation keeps rate cut hopes alive, but markets stay cautious

    December 23, 2024

    Technical Analysis – Gold returns above uptrend line

    December 23, 2024

    Subscribe to Updates

    Get the latest creative news from FooBar about art, design and business.

    Please enable JavaScript in your browser to complete this form.
    Loading
    © 2025 MyForexView.
    • Home
    • Analysis
    • Economic Calendar

    Type above and press Enter to search. Press Esc to cancel.