Close Menu
My Forex View

    Subscribe to Updates

    Get the latest creative news from FooBar about art, design and business.

    Please enable JavaScript in your browser to complete this form.
    Loading
    What's Hot

    Technical Analysis – USDJPY tests 158.00 level for first time in five months

    December 27, 2024

    Daily Comment – Soft PCE inflation keeps rate cut hopes alive, but markets stay cautious

    December 23, 2024

    Technical Analysis – Gold returns above uptrend line

    December 23, 2024
    Facebook X (Twitter) Instagram
    • Live Market
    • Learn Forex Trading
    • Technical Analysis
    Facebook X (Twitter) Instagram Pinterest Vimeo
    My Forex ViewMy Forex View
    • Home
    • Live Market
      • GBPUSD
      • EURUSD
      • USDJPY
      • XAUUSD
      • All Currency Pair
      • All Commodities Pair
    • Analysis
    • Free Forex Signals
    • Education
    • Tools
      • Economic Calendar
      • Currency Converter
      • Risk of Ruin Calculator
      • Pivot Points Calculator
      • Crypto Exchange Fees Calculator
      • Fibonacci Calculator
      • Forex Rebates
      • Margin Calculator
      • Compounding Calculator
      • Profit Calculator
      • Pip Calculator
      • Lot Size Calculator
      • Drawdown Calculator
    • Blog
    Join Telegram
    My Forex View
    Home » Technical Analysis – EURGBP sinks to the lowest since 2022
    EURGBP

    Technical Analysis – EURGBP sinks to the lowest since 2022

    Christina ParthenidouBy Christina ParthenidouSeptember 24, 2024Updated:November 7, 2024No Comments2 Mins Read
    Facebook Twitter LinkedIn Pinterest Email
    • EURGBP resumes downtrend, falls rapidly to 2½-year low
    • Oversold signals detected, price trades at the bottom of a channel

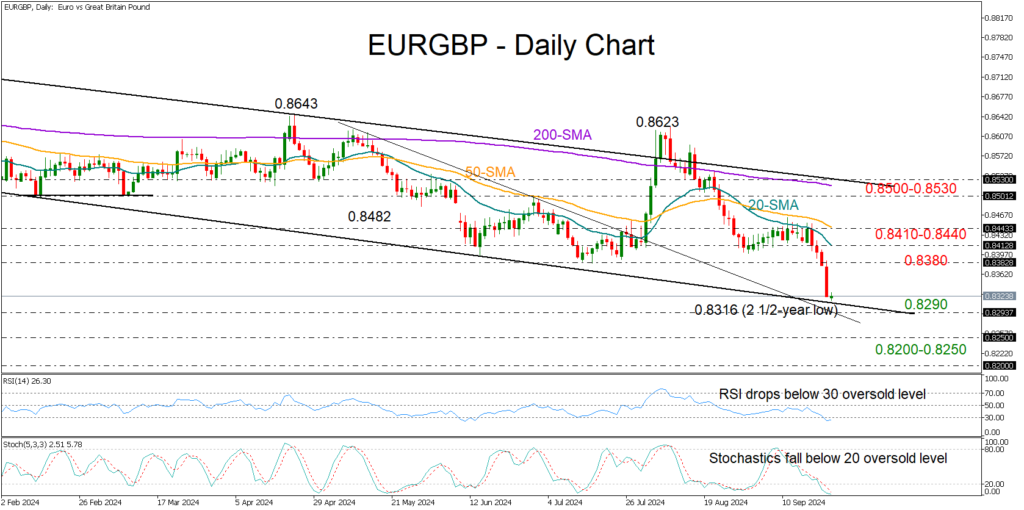
    EURGBP plummeted to a 2½-year low of 0.8316 but held above the support line of the almost one-year-old bearish channel, fueling hopes that the bulls could still find a footing.

    It is important to exercise caution as the RSI and stochastic oscillator have not yet found a bottom in the oversold zone, suggesting that downside pressures could persist for a bit longer before a potential upturn.

    If sellers press the price below 0.8290-0.8300, they may face a critical test between the 0.8250 handle and the 2022 six-year low of 0.8200. Below the latter, there is no key obstacle till the 2016 resistance of 0.8115.

    On the other hand, strong momentum is necessary for the bulls to overturn the current freefall and rise above July’s low of 0.8381. Closing above the 20-day simple moving average (SMA) at 0.8410 and the 50-day SMA at 0.8440 might be necessary as well to accelerate towards the 0.8500-0.8530 barrier.

    Still, the short-term outlook can only turn bullish if there is a sustainable rally above the 200-day SMA and the long-term bearish channel.

    Overall, although downside risks have not fully evaporated, EURGBP is trading near a significant support area, which suggests the possibility of bullish activity.

    Source by: XM Global

    Share. Facebook Twitter Pinterest LinkedIn Telegram WhatsApp Copy Link
    Previous ArticleTechnical Analysis – GBPUSD unlocks another new 2½-year high
    Next Article Daily Comment – China’s stimulus blitz supports positive equities sentiment

    Related Posts

    Technical Analysis

    Technical Analysis – USDJPY tests 158.00 level for first time in five months

    December 27, 2024
    Gold

    Technical Analysis – Gold returns above uptrend line

    December 23, 2024
    Technical Analysis

    Technical Analysis – USDCHF bulls are back and want to stay

    December 13, 2024
    Top Posts

    Get a Free Xmaster Formula Indicator Forex for MT4

    July 30, 2024102 Views

    Technical Analysis – ETHUSD trades flat after ETF debut

    July 25, 202446 Views

    Traders Dynamic Index (TDI): Best Strategies and Settings

    August 16, 202438 Views
    Stay In Touch
    • Facebook
    • YouTube
    • TikTok
    • WhatsApp
    • Twitter
    • Instagram

    Subscribe to Updates

    Get the latest tech news from FooBar about tech, design and biz.

    Most Popular

    Get a Free Xmaster Formula Indicator Forex for MT4

    July 30, 2024102 Views

    Technical Analysis – ETHUSD trades flat after ETF debut

    July 25, 202446 Views

    Traders Dynamic Index (TDI): Best Strategies and Settings

    August 16, 202438 Views
    Our Picks

    Technical Analysis – USDJPY tests 158.00 level for first time in five months

    December 27, 2024

    Daily Comment – Soft PCE inflation keeps rate cut hopes alive, but markets stay cautious

    December 23, 2024

    Technical Analysis – Gold returns above uptrend line

    December 23, 2024

    Subscribe to Updates

    Get the latest creative news from FooBar about art, design and business.

    Please enable JavaScript in your browser to complete this form.
    Loading
    © 2025 MyForexView.
    • Home
    • Analysis
    • Economic Calendar

    Type above and press Enter to search. Press Esc to cancel.