Close Menu
My Forex View

    Subscribe to Updates

    Get the latest creative news from FooBar about art, design and business.

    Please enable JavaScript in your browser to complete this form.
    Loading
    What's Hot

    Technical Analysis – USDJPY tests 158.00 level for first time in five months

    December 27, 2024

    Daily Comment – Soft PCE inflation keeps rate cut hopes alive, but markets stay cautious

    December 23, 2024

    Technical Analysis – Gold returns above uptrend line

    December 23, 2024
    Facebook X (Twitter) Instagram
    • Live Market
    • Learn Forex Trading
    • Technical Analysis
    Facebook X (Twitter) Instagram Pinterest Vimeo
    My Forex ViewMy Forex View
    • Home
    • Live Market
      • GBPUSD
      • EURUSD
      • USDJPY
      • XAUUSD
      • All Currency Pair
      • All Commodities Pair
    • Analysis
    • Free Forex Signals
    • Education
    • Tools
      • Economic Calendar
      • Currency Converter
      • Risk of Ruin Calculator
      • Pivot Points Calculator
      • Crypto Exchange Fees Calculator
      • Fibonacci Calculator
      • Forex Rebates
      • Margin Calculator
      • Compounding Calculator
      • Profit Calculator
      • Pip Calculator
      • Lot Size Calculator
      • Drawdown Calculator
    • Blog
    Join Telegram
    My Forex View
    Home » Technical Analysis – EURJPY builds base above 200-day SMA
    EURJPY

    Technical Analysis – EURJPY builds base above 200-day SMA

    Melina DeltasBy Melina DeltasNovember 5, 2024Updated:November 7, 2024No Comments2 Mins Read
    Facebook Twitter LinkedIn Pinterest Email
    • EURJPY attempts to rebound from 50.0% Fibonacci
    • Faces rejection at 3-month high but remains positive
    • Momentum oscillators remain cautiously titled to the upside

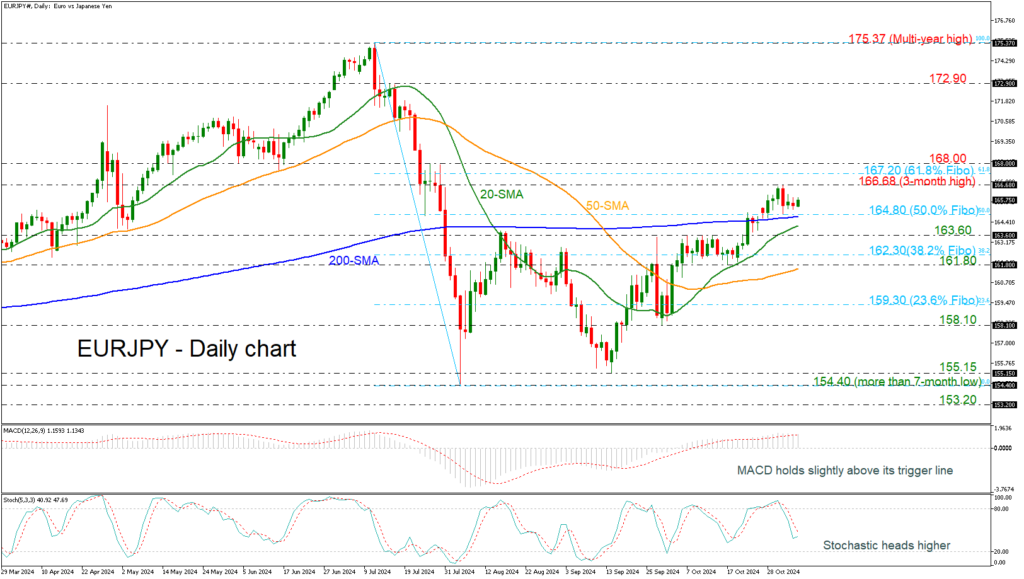
    EURJPY is still standing above the 200-day simple moving average (SMA) and the 50.0% Fibonacci retracement level of the downward wave from 175.37 to 154.40 at 164.80. The market added more than 7% after the pullback from the 155.15 support level, creating a bullish tendency in the short term.

    Technically, the MACD is moving above its trigger and zero lines, while the stochastic is turning higher above the 20 level. The SMAs are acting as a strong support level for the market.

    A move to the upside could see immediate resistance at the three-month high of 166.68, but should the market increase positive momentum above this area, the 61.8% Fibonacci at 167.20 could be the next level in focus. A stronger barrier, though, could be found at the 168.00 round number since any strong violation of this point could increase chances for further gains, probably toward the 172.90 hurdle.

    In the wake of negative pressures, the market could meet immediate support at the 50.0% Fibonacci of 164.80 and the 200-day SMA before it heads lower to the 20-day SMA at 164.20 and the inside swing highs of October 10 at 163.60. A successful close below this level could see a retest of the 38.2% Fibonacci of 162.30.

    If the price remains above the 200-day SMA and rallies beyond the 61.8% Fibonacci of 167.20, there is hope that the market may enter a bullish phase in the medium term.

    Source by: XM Global

    Share. Facebook Twitter Pinterest LinkedIn Telegram WhatsApp Copy Link
    Previous ArticleDaily Comment – Dollar gaps down as Trump seems to be losing Iowa
    Next Article Technical Analysis – US 500 index recoups some losses in short-term

    Related Posts

    Technical Analysis

    Technical Analysis – USDJPY tests 158.00 level for first time in five months

    December 27, 2024
    Gold

    Technical Analysis – Gold returns above uptrend line

    December 23, 2024
    Technical Analysis

    Technical Analysis – USDCHF bulls are back and want to stay

    December 13, 2024
    Top Posts

    Get a Free Xmaster Formula Indicator Forex for MT4

    July 30, 2024102 Views

    Technical Analysis – ETHUSD trades flat after ETF debut

    July 25, 202446 Views

    Traders Dynamic Index (TDI): Best Strategies and Settings

    August 16, 202438 Views
    Stay In Touch
    • Facebook
    • YouTube
    • TikTok
    • WhatsApp
    • Twitter
    • Instagram

    Subscribe to Updates

    Get the latest tech news from FooBar about tech, design and biz.

    Most Popular

    Get a Free Xmaster Formula Indicator Forex for MT4

    July 30, 2024102 Views

    Technical Analysis – ETHUSD trades flat after ETF debut

    July 25, 202446 Views

    Traders Dynamic Index (TDI): Best Strategies and Settings

    August 16, 202438 Views
    Our Picks

    Technical Analysis – USDJPY tests 158.00 level for first time in five months

    December 27, 2024

    Daily Comment – Soft PCE inflation keeps rate cut hopes alive, but markets stay cautious

    December 23, 2024

    Technical Analysis – Gold returns above uptrend line

    December 23, 2024

    Subscribe to Updates

    Get the latest creative news from FooBar about art, design and business.

    Please enable JavaScript in your browser to complete this form.
    Loading
    © 2025 MyForexView.
    • Home
    • Analysis
    • Economic Calendar

    Type above and press Enter to search. Press Esc to cancel.