Close Menu
My Forex View

    Subscribe to Updates

    Get the latest creative news from FooBar about art, design and business.

    Please enable JavaScript in your browser to complete this form.
    Loading
    What's Hot

    Technical Analysis – USDJPY tests 158.00 level for first time in five months

    December 27, 2024

    Daily Comment – Soft PCE inflation keeps rate cut hopes alive, but markets stay cautious

    December 23, 2024

    Technical Analysis – Gold returns above uptrend line

    December 23, 2024
    Facebook X (Twitter) Instagram
    • Live Market
    • Learn Forex Trading
    • Technical Analysis
    Facebook X (Twitter) Instagram Pinterest Vimeo
    My Forex ViewMy Forex View
    • Home
    • Live Market
      • GBPUSD
      • EURUSD
      • USDJPY
      • XAUUSD
      • All Currency Pair
      • All Commodities Pair
    • Analysis
    • Free Forex Signals
    • Education
    • Tools
      • Economic Calendar
      • Currency Converter
      • Risk of Ruin Calculator
      • Pivot Points Calculator
      • Crypto Exchange Fees Calculator
      • Fibonacci Calculator
      • Forex Rebates
      • Margin Calculator
      • Compounding Calculator
      • Profit Calculator
      • Pip Calculator
      • Lot Size Calculator
      • Drawdown Calculator
    • Blog
    Join Telegram
    My Forex View
    Home » Technical Analysis – EURJPY develops beneath 200-day SMA
    EURJPY

    Technical Analysis – EURJPY develops beneath 200-day SMA

    Melina DeltasBy Melina DeltasAugust 27, 2024Updated:November 7, 2024No Comments2 Mins Read
    Facebook Twitter LinkedIn Pinterest Email
    • EURJPY lost 12% from multi-year high
    • Short-term bias skewed to the upside, but caution needed

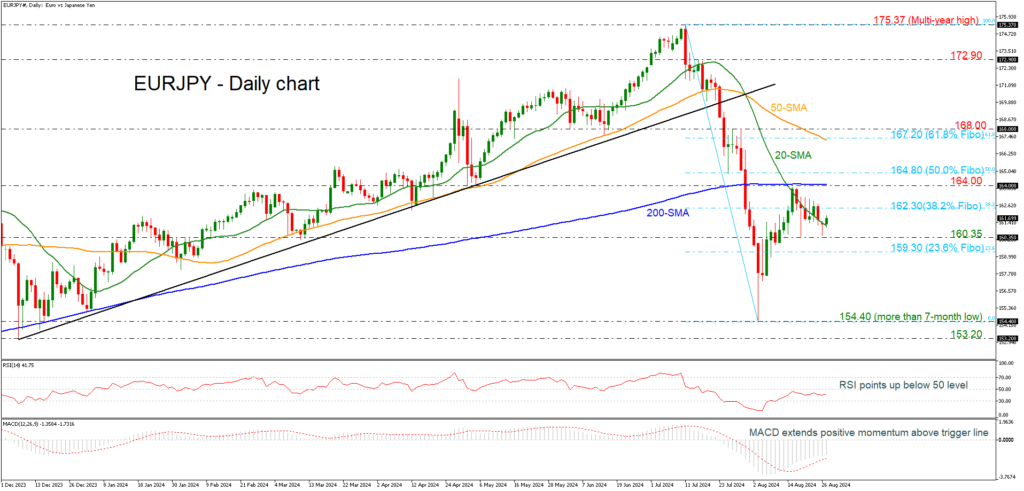
    EURJPY remains under pressure, and risk is still on the downside as prices continue to drift lower after the failure attempt to climb beyond the 200-day simple moving average (SMA) at 164.00. In the bigger picture, EURJPY has lost around 12% from the multi-year high of 157.37 to the seven-month low of 154.40.

    Prices rebounded off the 160.35 support level, but based on technical oscillators, momentum is still too weak to provide a sustained move higher. The RSI is sloping marginally up below the neutral threshold of 50, while the MACD is standing above its trigger line in negative territory.

    Upside moves are likely to find immediate resistance at the 38.2% Fibonacci retracement level of the downward wave from 175.37 to 154.40 at 162.30. There is an important resistance zone between 164.00 and 164.80 (50.0% Fibonacci level). Rising above this area would help shift the focus to the upside towards the 50-day SMA, which overlaps with the 61.8% Fibonacci at 167.20.

    To the downside, the latest bottom at 160.35 could be a key level for traders before hitting the 23.6% Fibonacci at 159.30. Steeper decreases could take the pair towards the more-than-seven-month low of 154.40.

    In the short term, the bearish phase remains in play, especially if EURJPY continues to trade below the 200-day SMA and the 61.8% Fibonacci of 167.20. In the bigger picture, the market is bullish as long as the 200-week SMA holds.

    Source by: XM Global

    Share. Facebook Twitter Pinterest LinkedIn Telegram WhatsApp Copy Link
    Previous ArticleTechnical Analysis – USDJPY trims August gains
    Next Article Technical Analysis – US 500 cash index flirts with previous all-time high

    Related Posts

    Technical Analysis

    Technical Analysis – USDJPY tests 158.00 level for first time in five months

    December 27, 2024
    Gold

    Technical Analysis – Gold returns above uptrend line

    December 23, 2024
    Technical Analysis

    Technical Analysis – USDCHF bulls are back and want to stay

    December 13, 2024
    Top Posts

    Get a Free Xmaster Formula Indicator Forex for MT4

    July 30, 2024102 Views

    Technical Analysis – ETHUSD trades flat after ETF debut

    July 25, 202446 Views

    Traders Dynamic Index (TDI): Best Strategies and Settings

    August 16, 202438 Views
    Stay In Touch
    • Facebook
    • YouTube
    • TikTok
    • WhatsApp
    • Twitter
    • Instagram

    Subscribe to Updates

    Get the latest tech news from FooBar about tech, design and biz.

    Most Popular

    Get a Free Xmaster Formula Indicator Forex for MT4

    July 30, 2024102 Views

    Technical Analysis – ETHUSD trades flat after ETF debut

    July 25, 202446 Views

    Traders Dynamic Index (TDI): Best Strategies and Settings

    August 16, 202438 Views
    Our Picks

    Technical Analysis – USDJPY tests 158.00 level for first time in five months

    December 27, 2024

    Daily Comment – Soft PCE inflation keeps rate cut hopes alive, but markets stay cautious

    December 23, 2024

    Technical Analysis – Gold returns above uptrend line

    December 23, 2024

    Subscribe to Updates

    Get the latest creative news from FooBar about art, design and business.

    Please enable JavaScript in your browser to complete this form.
    Loading
    © 2025 MyForexView.
    • Home
    • Analysis
    • Economic Calendar

    Type above and press Enter to search. Press Esc to cancel.