Close Menu
My Forex View

    Subscribe to Updates

    Get the latest creative news from FooBar about art, design and business.

    Please enable JavaScript in your browser to complete this form.
    Loading
    What's Hot

    Technical Analysis – USDJPY tests 158.00 level for first time in five months

    December 27, 2024

    Daily Comment – Soft PCE inflation keeps rate cut hopes alive, but markets stay cautious

    December 23, 2024

    Technical Analysis – Gold returns above uptrend line

    December 23, 2024
    Facebook X (Twitter) Instagram
    • Live Market
    • Learn Forex Trading
    • Technical Analysis
    Facebook X (Twitter) Instagram Pinterest Vimeo
    My Forex ViewMy Forex View
    • Home
    • Live Market
      • GBPUSD
      • EURUSD
      • USDJPY
      • XAUUSD
      • All Currency Pair
      • All Commodities Pair
    • Analysis
    • Free Forex Signals
    • Education
    • Tools
      • Economic Calendar
      • Currency Converter
      • Risk of Ruin Calculator
      • Pivot Points Calculator
      • Crypto Exchange Fees Calculator
      • Fibonacci Calculator
      • Forex Rebates
      • Margin Calculator
      • Compounding Calculator
      • Profit Calculator
      • Pip Calculator
      • Lot Size Calculator
      • Drawdown Calculator
    • Blog
    Join Telegram
    My Forex View
    Home » Technical Analysis – EURJPY eases from 38.2% Fibonacci
    EURJPY

    Technical Analysis – EURJPY eases from 38.2% Fibonacci

    Melina DeltasBy Melina DeltasSeptember 3, 2024Updated:November 7, 2024No Comments2 Mins Read
    Facebook Twitter LinkedIn Pinterest Email
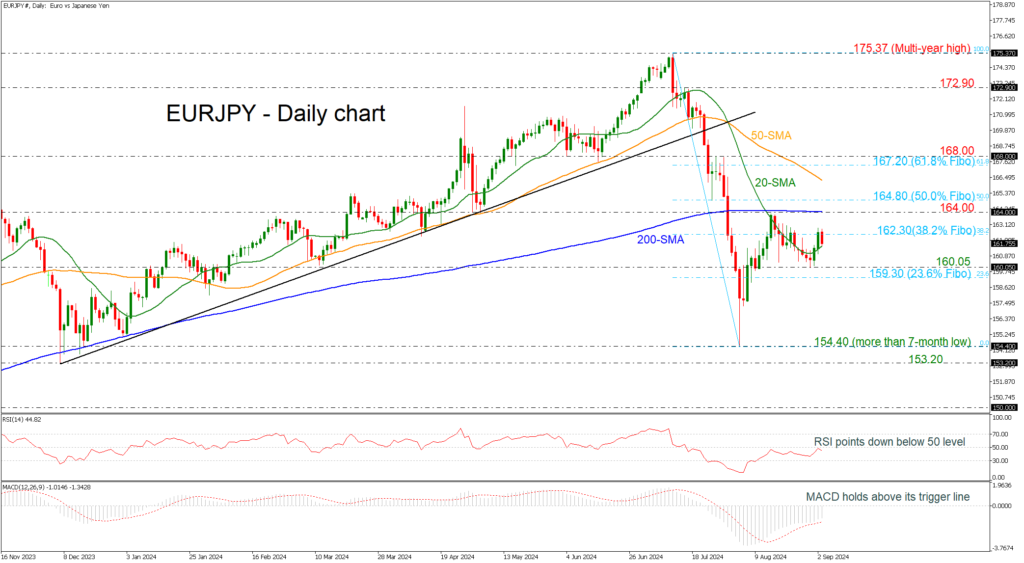
    • EURJPY may find significant resistance at 164.00
    • Rebound off a 7-month low still holds
    • RSI heads down below 50 level
    • MACD recovers above its trigger line

    EURJPY is currently heading south following the unsuccessful battle with the 162.30 resistance level, which is the 38.2% Fibonacci retracement level of the down leg from 175.37 to 154.40. However, a more important struggle for the bulls could come at the 164.00 psychological level, which coincides with the 200-day simple moving average (SMA).

    Technical oscillators show some mixed signs. The RSI is pointing downwards beneath the neutral threshold of 50, whereas the MACD is extending its positive momentum above its trigger line.

    If the price has a closing session beyond the 162.30 barrier, then the fight with 164.00 would start. A break above it would open the way for a test of the 50.0% Fibonacci of 164.80 before meeting the 50-day SMA at 166.30.

    In the negative scenario, a move lower could take the market towards the 159.30-160.05 support region, which encapsulates the 23.6% Fibonacci. More downside pressure could drive the bears towards the more-than-seven-month low of 154.40.

    EURJPY has showed some improvement since the bearish spike on August 5 but there is lot of room to cover for changing the outlook to bullish.  

    Source by: XM Global

    Share. Facebook Twitter Pinterest LinkedIn Telegram WhatsApp Copy Link
    Previous ArticleDaily Comment – Dollar gains amid adjusted Fed rate cut bets
    Next Article Technical Analysis – GBPUSD takes a negative turn

    Related Posts

    Technical Analysis

    Technical Analysis – USDJPY tests 158.00 level for first time in five months

    December 27, 2024
    Gold

    Technical Analysis – Gold returns above uptrend line

    December 23, 2024
    Technical Analysis

    Technical Analysis – USDCHF bulls are back and want to stay

    December 13, 2024
    Top Posts

    Get a Free Xmaster Formula Indicator Forex for MT4

    July 30, 2024102 Views

    Technical Analysis – ETHUSD trades flat after ETF debut

    July 25, 202446 Views

    Traders Dynamic Index (TDI): Best Strategies and Settings

    August 16, 202438 Views
    Stay In Touch
    • Facebook
    • YouTube
    • TikTok
    • WhatsApp
    • Twitter
    • Instagram

    Subscribe to Updates

    Get the latest tech news from FooBar about tech, design and biz.

    Most Popular

    Get a Free Xmaster Formula Indicator Forex for MT4

    July 30, 2024102 Views

    Technical Analysis – ETHUSD trades flat after ETF debut

    July 25, 202446 Views

    Traders Dynamic Index (TDI): Best Strategies and Settings

    August 16, 202438 Views
    Our Picks

    Technical Analysis – USDJPY tests 158.00 level for first time in five months

    December 27, 2024

    Daily Comment – Soft PCE inflation keeps rate cut hopes alive, but markets stay cautious

    December 23, 2024

    Technical Analysis – Gold returns above uptrend line

    December 23, 2024

    Subscribe to Updates

    Get the latest creative news from FooBar about art, design and business.

    Please enable JavaScript in your browser to complete this form.
    Loading
    © 2025 MyForexView.
    • Home
    • Analysis
    • Economic Calendar

    Type above and press Enter to search. Press Esc to cancel.