Close Menu
My Forex View

    Subscribe to Updates

    Get the latest creative news from FooBar about art, design and business.

    Please enable JavaScript in your browser to complete this form.
    Loading
    What's Hot

    Technical Analysis – USDJPY tests 158.00 level for first time in five months

    December 27, 2024

    Daily Comment – Soft PCE inflation keeps rate cut hopes alive, but markets stay cautious

    December 23, 2024

    Technical Analysis – Gold returns above uptrend line

    December 23, 2024
    Facebook X (Twitter) Instagram
    • Live Market
    • Learn Forex Trading
    • Technical Analysis
    Facebook X (Twitter) Instagram Pinterest Vimeo
    My Forex ViewMy Forex View
    • Home
    • Live Market
      • GBPUSD
      • EURUSD
      • USDJPY
      • XAUUSD
      • All Currency Pair
      • All Commodities Pair
    • Analysis
    • Free Forex Signals
    • Education
    • Tools
      • Economic Calendar
      • Currency Converter
      • Risk of Ruin Calculator
      • Pivot Points Calculator
      • Crypto Exchange Fees Calculator
      • Fibonacci Calculator
      • Forex Rebates
      • Margin Calculator
      • Compounding Calculator
      • Profit Calculator
      • Pip Calculator
      • Lot Size Calculator
      • Drawdown Calculator
    • Blog
    Join Telegram
    My Forex View
    Home » Technical Analysis – EURJPY slightly bullish ahead of key obstacles
    EURJPY

    Technical Analysis – EURJPY slightly bullish ahead of key obstacles

    Raffi BoyadjianBy Raffi BoyadjianOctober 22, 2024Updated:November 7, 2024No Comments2 Mins Read
    Facebook Twitter LinkedIn Pinterest Email
    • EURJPY still consolidating but immediate bias is bullish
    • Major resistance area lies ahead

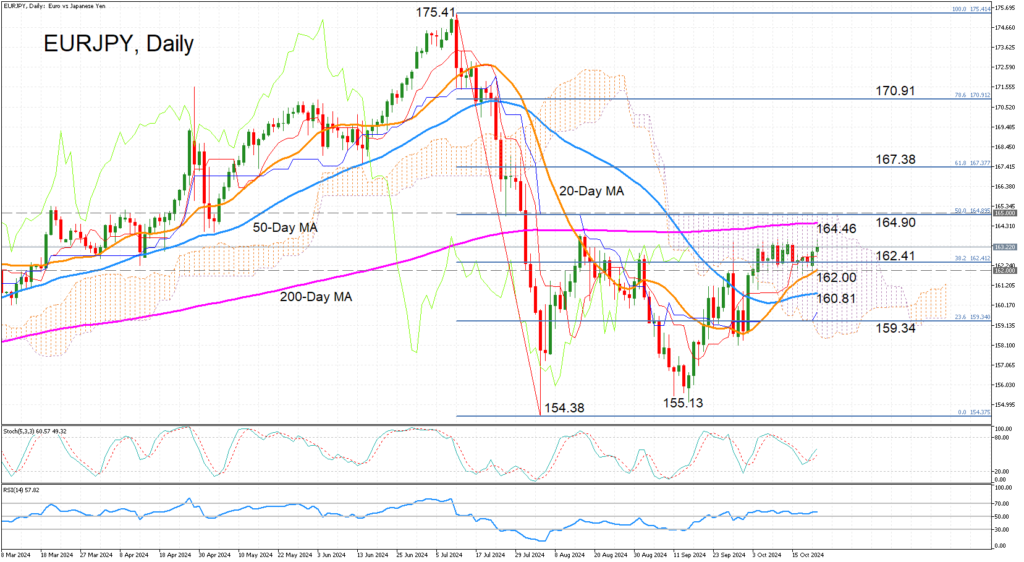
    EURJPY has been trading within a narrow sideways range since early October, but the immediate bias has turned positive over the last couple of sessions. The stochastic oscillator is trending upwards, while the RSI is slightly above its 50-neutral level.

    The price reached a two-month intra-day peak of 163.65 earlier on Tuesday before pulling back, reflecting a very weak upside momentum. But even if the bulls manage to stay in control and plough ahead, getting past the 164.45-165.00 region will be very difficult.

    The 200-day simple moving average (SMA) is blocking the way at 164.46, while the 50% Fibonacci retracement of the July-August down leg stands at 164.90. Furthermore, the top of the Ichimoku cloud overlaps with the 50% Fibonacci, underscoring the significance of this resistance region.

    Nonetheless, a successful breakout above 165.00 would shift the medium-term picture from neutral to bullish and clear the way towards the 61.8% Fibonacci of 167.38.

    If, though, the bulls fail to make much progress and the positive momentum fades, there’s likely to be strong support around the 20-day SMA just above the 162.00 mark. Slipping below this level would bring the 50-day SMA under the spotlight at 160.81 before sellers turn their attention to the 23.6% Fibonacci of 159.34.

    A drop beneath the 23.6% Fibonacci would also take the price below the Ichimoku cloud, risking a return to the bearish phase.

    In brief, EURJPY still has a chance of resuming its rebound from the September low, but reclaiming the crucial 165.00 handle will not be easy.

    Source by: XM Global

    Share. Facebook Twitter Pinterest LinkedIn Telegram WhatsApp Copy Link
    Previous ArticleTechnical Analysis – USDJPY poised for a bullish trend reversal
    Next Article Daily Comment – Demand for safe assets lingers

    Related Posts

    Technical Analysis

    Technical Analysis – USDJPY tests 158.00 level for first time in five months

    December 27, 2024
    Gold

    Technical Analysis – Gold returns above uptrend line

    December 23, 2024
    Technical Analysis

    Technical Analysis – USDCHF bulls are back and want to stay

    December 13, 2024
    Top Posts

    Get a Free Xmaster Formula Indicator Forex for MT4

    July 30, 2024102 Views

    Technical Analysis – ETHUSD trades flat after ETF debut

    July 25, 202446 Views

    Traders Dynamic Index (TDI): Best Strategies and Settings

    August 16, 202438 Views
    Stay In Touch
    • Facebook
    • YouTube
    • TikTok
    • WhatsApp
    • Twitter
    • Instagram

    Subscribe to Updates

    Get the latest tech news from FooBar about tech, design and biz.

    Most Popular

    Get a Free Xmaster Formula Indicator Forex for MT4

    July 30, 2024102 Views

    Technical Analysis – ETHUSD trades flat after ETF debut

    July 25, 202446 Views

    Traders Dynamic Index (TDI): Best Strategies and Settings

    August 16, 202438 Views
    Our Picks

    Technical Analysis – USDJPY tests 158.00 level for first time in five months

    December 27, 2024

    Daily Comment – Soft PCE inflation keeps rate cut hopes alive, but markets stay cautious

    December 23, 2024

    Technical Analysis – Gold returns above uptrend line

    December 23, 2024

    Subscribe to Updates

    Get the latest creative news from FooBar about art, design and business.

    Please enable JavaScript in your browser to complete this form.
    Loading
    © 2025 MyForexView.
    • Home
    • Analysis
    • Economic Calendar

    Type above and press Enter to search. Press Esc to cancel.