Close Menu
My Forex View

    Subscribe to Updates

    Get the latest creative news from FooBar about art, design and business.

    Please enable JavaScript in your browser to complete this form.
    Loading
    What's Hot

    Technical Analysis – USDJPY tests 158.00 level for first time in five months

    December 27, 2024

    Daily Comment – Soft PCE inflation keeps rate cut hopes alive, but markets stay cautious

    December 23, 2024

    Technical Analysis – Gold returns above uptrend line

    December 23, 2024
    Facebook X (Twitter) Instagram
    • Live Market
    • Learn Forex Trading
    • Technical Analysis
    Facebook X (Twitter) Instagram Pinterest Vimeo
    My Forex ViewMy Forex View
    • Home
    • Live Market
      • GBPUSD
      • EURUSD
      • USDJPY
      • XAUUSD
      • All Currency Pair
      • All Commodities Pair
    • Analysis
    • Free Forex Signals
    • Education
    • Tools
      • Economic Calendar
      • Currency Converter
      • Risk of Ruin Calculator
      • Pivot Points Calculator
      • Crypto Exchange Fees Calculator
      • Fibonacci Calculator
      • Forex Rebates
      • Margin Calculator
      • Compounding Calculator
      • Profit Calculator
      • Pip Calculator
      • Lot Size Calculator
      • Drawdown Calculator
    • Blog
    Join Telegram
    My Forex View
    Home » Technical Analysis – EURUSD bulls stay in charge
    EURUSD

    Technical Analysis – EURUSD bulls stay in charge

    Charalampos PissourosBy Charalampos PissourosAugust 21, 2024Updated:November 7, 2024No Comments2 Mins Read
    Facebook Twitter LinkedIn Pinterest Email
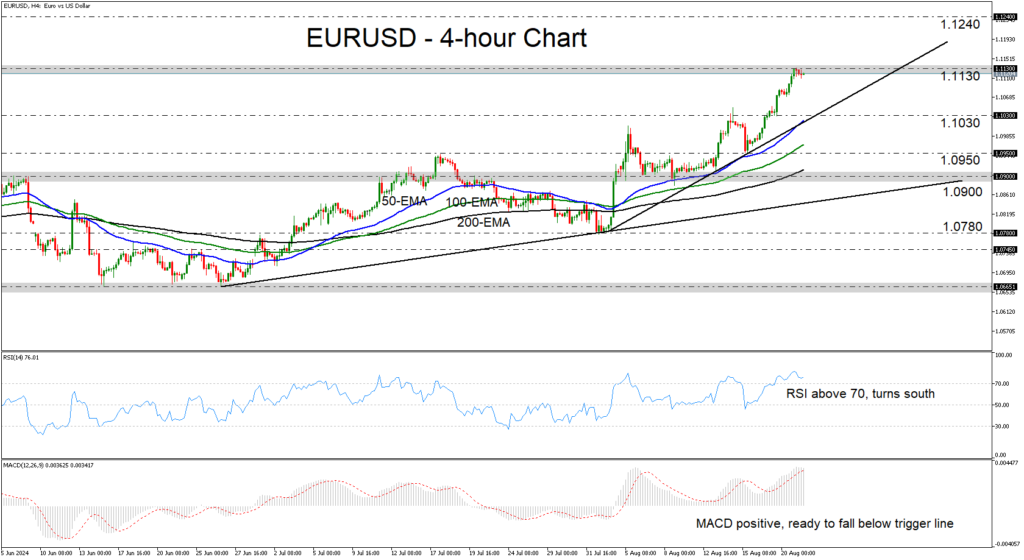
    • EURUSD extends rally, hits 1.1130
    • But oscillators point to fading momentum
    • A setback may be possible before the next leg north

    EURUSD has been in a steady rally since August 15, when it hit support at 1.0950, and it is currently testing the key resistance zone of 1.1130, a zone that stopped the bulls from heading further north back in December, as well as back in July 2023. Overall, the pair is trading above a short-term uptrend line drawn from the low of August 2, and well above the upper bound of a prior sideways range, at around 1.0900.

    Although the technical picture on the 4-hour chart appears to be overly bullish, the short-term oscillators are suggesting that the upside momentum is fading, which means that a corrective setback may be in the works before the next leg north. The RSI has peaked within its above-70 zone, while the MACD, although extremely positive, has turned south as well and looks ready to fall below its trigger line.

    A retreat may invite buyers from near the aforementioned uptrend line and the 1.1030. If this is the case, another bullish wave could surpass the 1.1130 high and aim for the 1.1240 area, marked by the high of March 1, 2022.

    On the downside, a dip below 1.1030 could trigger a larger correction, as it would also take the pair below the short-term uptrend line. The bears may feel confident in targeting the low of August 15, at 1.0950, or the upper bound of the sideways range that contained most of the price action since the beginning of the year. That bound stands at 1.0900.

    To recap, EURUSD remains in a steep short-term uptrend, but the short-term oscillators suggest that a corrective slide may be on the cards before the next impulsive wave.

    Source by: XM Global

    Share. Facebook Twitter Pinterest LinkedIn Telegram WhatsApp Copy Link
    Previous ArticleHow to Identify the Best Expert Advisor in Forex Trading
    Next Article Technical Analysis – US 30 index loses steam near July’s barrier

    Related Posts

    Technical Analysis

    Technical Analysis – USDJPY tests 158.00 level for first time in five months

    December 27, 2024
    Gold

    Technical Analysis – Gold returns above uptrend line

    December 23, 2024
    Technical Analysis

    Technical Analysis – USDCHF bulls are back and want to stay

    December 13, 2024
    Top Posts

    Get a Free Xmaster Formula Indicator Forex for MT4

    July 30, 2024102 Views

    Technical Analysis – ETHUSD trades flat after ETF debut

    July 25, 202446 Views

    Traders Dynamic Index (TDI): Best Strategies and Settings

    August 16, 202438 Views
    Stay In Touch
    • Facebook
    • YouTube
    • TikTok
    • WhatsApp
    • Twitter
    • Instagram

    Subscribe to Updates

    Get the latest tech news from FooBar about tech, design and biz.

    Most Popular

    Get a Free Xmaster Formula Indicator Forex for MT4

    July 30, 2024102 Views

    Technical Analysis – ETHUSD trades flat after ETF debut

    July 25, 202446 Views

    Traders Dynamic Index (TDI): Best Strategies and Settings

    August 16, 202438 Views
    Our Picks

    Technical Analysis – USDJPY tests 158.00 level for first time in five months

    December 27, 2024

    Daily Comment – Soft PCE inflation keeps rate cut hopes alive, but markets stay cautious

    December 23, 2024

    Technical Analysis – Gold returns above uptrend line

    December 23, 2024

    Subscribe to Updates

    Get the latest creative news from FooBar about art, design and business.

    Please enable JavaScript in your browser to complete this form.
    Loading
    © 2025 MyForexView.
    • Home
    • Analysis
    • Economic Calendar

    Type above and press Enter to search. Press Esc to cancel.