Close Menu
My Forex View

    Subscribe to Updates

    Get the latest creative news from FooBar about art, design and business.

    Please enable JavaScript in your browser to complete this form.
    Loading
    What's Hot

    Technical Analysis – USDJPY tests 158.00 level for first time in five months

    December 27, 2024

    Daily Comment – Soft PCE inflation keeps rate cut hopes alive, but markets stay cautious

    December 23, 2024

    Technical Analysis – Gold returns above uptrend line

    December 23, 2024
    Facebook X (Twitter) Instagram
    • Live Market
    • Learn Forex Trading
    • Technical Analysis
    Facebook X (Twitter) Instagram Pinterest Vimeo
    My Forex ViewMy Forex View
    • Home
    • Live Market
      • GBPUSD
      • EURUSD
      • USDJPY
      • XAUUSD
      • All Currency Pair
      • All Commodities Pair
    • Analysis
    • Free Forex Signals
    • Education
    • Tools
      • Economic Calendar
      • Currency Converter
      • Risk of Ruin Calculator
      • Pivot Points Calculator
      • Crypto Exchange Fees Calculator
      • Fibonacci Calculator
      • Forex Rebates
      • Margin Calculator
      • Compounding Calculator
      • Profit Calculator
      • Pip Calculator
      • Lot Size Calculator
      • Drawdown Calculator
    • Blog
    Join Telegram
    My Forex View
    Home » Technical Analysis – EURUSD pulls back towards converging SMAs
    EURUSD

    Technical Analysis – EURUSD pulls back towards converging SMAs

    Stefanos OikonomidisBy Stefanos OikonomidisJuly 25, 2024Updated:November 7, 2024No Comments2 Mins Read
    Facebook Twitter LinkedIn Pinterest Email
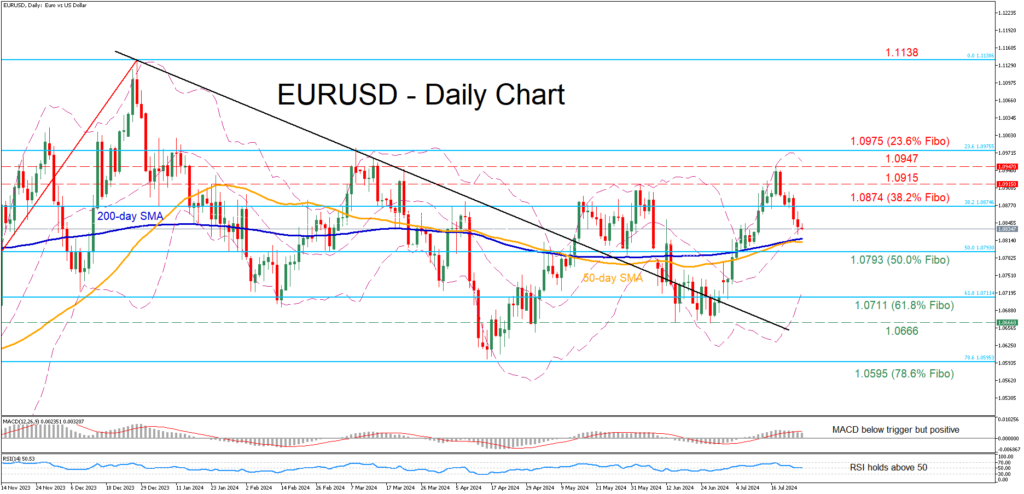
    1. EURUSD retraces lower after hitting 4-month high
    2. The bears eye converging 50- and 200-day SMAs
    3. Oscillators deteriorate but remain in positive zones

    EURUSD had been rising steadily following its bullish breakout from a downward sloping trendline in early July, posting a fresh four-month peak of 1.0947 last week. However, the pair has been experiencing a correction since then, with the price approaching the converging 50- and 200-day simple moving averages (SMAs).

    Should the retreat extend further and the pair break below its SMAs, initial support could be found at 1.0793, which is the 50.0% Fibonacci retracement of the 1.0447-1.1138 upleg. Lower, the 61.8% Fibo of 1.0711 might act as the next line of defense. Failing to halt there, the pair may then decline towards the June bottom of 1.0666.

    Alternatively, if the price reverses back higher, the 38.2% Fibo of 1.0874 could prevent initial upside attempts. A violation of that hurdle could pave the way for the June peak of 1.0915 ahead of the recent four-month high of 1.0947. Claiming the latter barricade, the bulls could attack the 23.6% Fibo of 1.0975.

    In brief, EURUSD has come under selling pressure after posting a fresh four-month high last week. Should the pullback extend further, the pair’s next crucial battle will probably take place around the converging 50- and 200-day SMAs.

    Source by: XM Global

    Share. Facebook Twitter Pinterest LinkedIn Telegram WhatsApp Copy Link
    Previous ArticleTechnical Analysis – ETHUSD trades flat after ETF debut
    Next Article Technical Analysis – WTI crude oil creates bearish wave

    Related Posts

    Technical Analysis

    Technical Analysis – USDJPY tests 158.00 level for first time in five months

    December 27, 2024
    Gold

    Technical Analysis – Gold returns above uptrend line

    December 23, 2024
    Technical Analysis

    Technical Analysis – USDCHF bulls are back and want to stay

    December 13, 2024
    Top Posts

    Get a Free Xmaster Formula Indicator Forex for MT4

    July 30, 2024102 Views

    Technical Analysis – ETHUSD trades flat after ETF debut

    July 25, 202446 Views

    Traders Dynamic Index (TDI): Best Strategies and Settings

    August 16, 202438 Views
    Stay In Touch
    • Facebook
    • YouTube
    • TikTok
    • WhatsApp
    • Twitter
    • Instagram

    Subscribe to Updates

    Get the latest tech news from FooBar about tech, design and biz.

    Most Popular

    Get a Free Xmaster Formula Indicator Forex for MT4

    July 30, 2024102 Views

    Technical Analysis – ETHUSD trades flat after ETF debut

    July 25, 202446 Views

    Traders Dynamic Index (TDI): Best Strategies and Settings

    August 16, 202438 Views
    Our Picks

    Technical Analysis – USDJPY tests 158.00 level for first time in five months

    December 27, 2024

    Daily Comment – Soft PCE inflation keeps rate cut hopes alive, but markets stay cautious

    December 23, 2024

    Technical Analysis – Gold returns above uptrend line

    December 23, 2024

    Subscribe to Updates

    Get the latest creative news from FooBar about art, design and business.

    Please enable JavaScript in your browser to complete this form.
    Loading
    © 2025 MyForexView.
    • Home
    • Analysis
    • Economic Calendar

    Type above and press Enter to search. Press Esc to cancel.