Close Menu
My Forex View

    Subscribe to Updates

    Get the latest creative news from FooBar about art, design and business.

    Please enable JavaScript in your browser to complete this form.
    Loading
    What's Hot

    Technical Analysis – USDJPY tests 158.00 level for first time in five months

    December 27, 2024

    Daily Comment – Soft PCE inflation keeps rate cut hopes alive, but markets stay cautious

    December 23, 2024

    Technical Analysis – Gold returns above uptrend line

    December 23, 2024
    Facebook X (Twitter) Instagram
    • Live Market
    • Learn Forex Trading
    • Technical Analysis
    Facebook X (Twitter) Instagram Pinterest Vimeo
    My Forex ViewMy Forex View
    • Home
    • Live Market
      • GBPUSD
      • EURUSD
      • USDJPY
      • XAUUSD
      • All Currency Pair
      • All Commodities Pair
    • Analysis
    • Free Forex Signals
    • Education
    • Tools
      • Economic Calendar
      • Currency Converter
      • Risk of Ruin Calculator
      • Pivot Points Calculator
      • Crypto Exchange Fees Calculator
      • Fibonacci Calculator
      • Forex Rebates
      • Margin Calculator
      • Compounding Calculator
      • Profit Calculator
      • Pip Calculator
      • Lot Size Calculator
      • Drawdown Calculator
    • Blog
    Join Telegram
    My Forex View
    Home » Technical Analysis – EURUSD tests 1.1050 tricky area
    EURUSD

    Technical Analysis – EURUSD tests 1.1050 tricky area

    Melina DeltasBy Melina DeltasAugust 19, 2024Updated:November 7, 2024No Comments2 Mins Read
    Facebook Twitter LinkedIn Pinterest Email
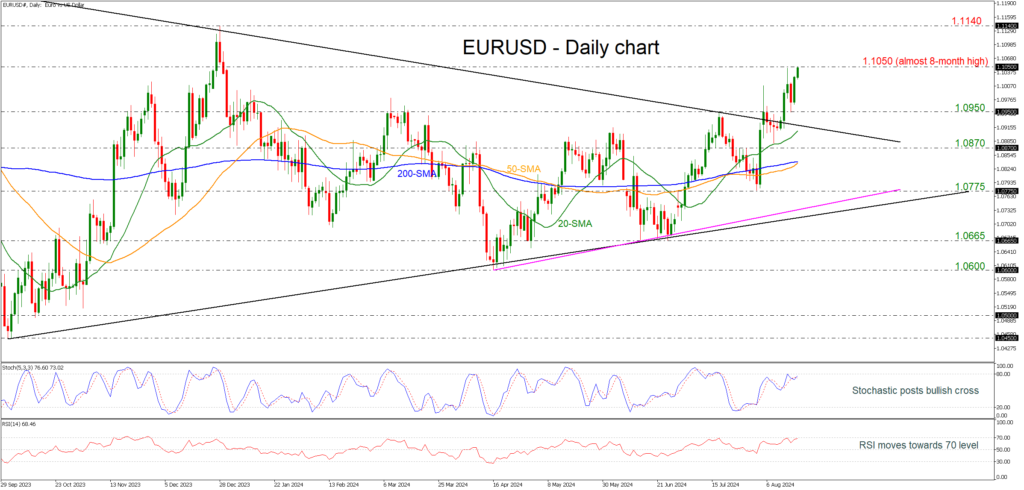
    • EURUSD flirts with 8-month high again
    • Remains well above the long-term symmetrical triangle
    • 50- and 200-day SMAs ready for bullish cross
    • Momentum oscillators confirm upside move

    EURUSD has been in a bullish move, especially after the rally above the long-term symmetrical triangle last week. The pair is again battling with the almost eight-month high of 1.1050, with the simple moving averages (SMAs) mirroring the current upside movement as they are all ticking higher. Additionally, the 50-day SMA is ready to cross above the 200-day SMA.

    According to technical oscillators, the %K and %D lines of the stochastic are posting a bullish crossover, while the RSI is flirting with the 70 levels with strong momentum.

    If the pair reactivates its uptrend above the previous top, the next target will be the 1.1140 resistance, taken from the peak in December 2023. Even higher, the bulls might head for the 1.1275 number, which was a key resistance area during the second half of 2023.

    On the downside, the 1.0950 support has been guarding selling forces over the past two days. Beneath that line, the 20-day SMA around 1.0900 might produce fresh negative volatility, likely squeezing the price towards the 1.0870 barricade. Another defeat there could add more fuel to the bearish wave, bringing the 200-day SMA at 1.0840 immediately under the spotlight.

    Overall, EURUSD is sustaining an upward trend as long as it stands above the previous sideways pattern and the 1.1000 psychological mark. To attract new buyers, the pair will need to pierce through the 1.1050 bar. 

    Source by: XM Global

    Share. Facebook Twitter Pinterest LinkedIn Telegram WhatsApp Copy Link
    Previous ArticleWhat is the Ichimoku Bbs Cloud and how do you use it in trading?
    Next Article Technical Analysis – US 500 index slips after 10% recovery

    Related Posts

    Technical Analysis

    Technical Analysis – USDJPY tests 158.00 level for first time in five months

    December 27, 2024
    Gold

    Technical Analysis – Gold returns above uptrend line

    December 23, 2024
    Technical Analysis

    Technical Analysis – USDCHF bulls are back and want to stay

    December 13, 2024
    Top Posts

    Get a Free Xmaster Formula Indicator Forex for MT4

    July 30, 2024102 Views

    Technical Analysis – ETHUSD trades flat after ETF debut

    July 25, 202446 Views

    Traders Dynamic Index (TDI): Best Strategies and Settings

    August 16, 202438 Views
    Stay In Touch
    • Facebook
    • YouTube
    • TikTok
    • WhatsApp
    • Twitter
    • Instagram

    Subscribe to Updates

    Get the latest tech news from FooBar about tech, design and biz.

    Most Popular

    Get a Free Xmaster Formula Indicator Forex for MT4

    July 30, 2024102 Views

    Technical Analysis – ETHUSD trades flat after ETF debut

    July 25, 202446 Views

    Traders Dynamic Index (TDI): Best Strategies and Settings

    August 16, 202438 Views
    Our Picks

    Technical Analysis – USDJPY tests 158.00 level for first time in five months

    December 27, 2024

    Daily Comment – Soft PCE inflation keeps rate cut hopes alive, but markets stay cautious

    December 23, 2024

    Technical Analysis – Gold returns above uptrend line

    December 23, 2024

    Subscribe to Updates

    Get the latest creative news from FooBar about art, design and business.

    Please enable JavaScript in your browser to complete this form.
    Loading
    © 2025 MyForexView.
    • Home
    • Analysis
    • Economic Calendar

    Type above and press Enter to search. Press Esc to cancel.