Close Menu
My Forex View

    Subscribe to Updates

    Get the latest creative news from FooBar about art, design and business.

    Please enable JavaScript in your browser to complete this form.
    Loading
    What's Hot

    Technical Analysis – USDJPY tests 158.00 level for first time in five months

    December 27, 2024

    Daily Comment – Soft PCE inflation keeps rate cut hopes alive, but markets stay cautious

    December 23, 2024

    Technical Analysis – Gold returns above uptrend line

    December 23, 2024
    Facebook X (Twitter) Instagram
    • Live Market
    • Learn Forex Trading
    • Technical Analysis
    Facebook X (Twitter) Instagram Pinterest Vimeo
    My Forex ViewMy Forex View
    • Home
    • Live Market
      • GBPUSD
      • EURUSD
      • USDJPY
      • XAUUSD
      • All Currency Pair
      • All Commodities Pair
    • Analysis
    • Free Forex Signals
    • Education
    • Tools
      • Economic Calendar
      • Currency Converter
      • Risk of Ruin Calculator
      • Pivot Points Calculator
      • Crypto Exchange Fees Calculator
      • Fibonacci Calculator
      • Forex Rebates
      • Margin Calculator
      • Compounding Calculator
      • Profit Calculator
      • Pip Calculator
      • Lot Size Calculator
      • Drawdown Calculator
    • Blog
    Join Telegram
    My Forex View
    Home » Technical Analysis – EURUSD turns neutral amid double-top formation
    EURUSD

    Technical Analysis – EURUSD turns neutral amid double-top formation

    Raffi BoyadjianBy Raffi BoyadjianOctober 1, 2024Updated:November 7, 2024No Comments2 Mins Read
    Facebook Twitter LinkedIn Pinterest Email
    • EURUSD holds above 20-day SMA but bias turns neutral
    • Bulls still have a chance as field of support levels lies beneath
    • But double-top formation hard to ignore

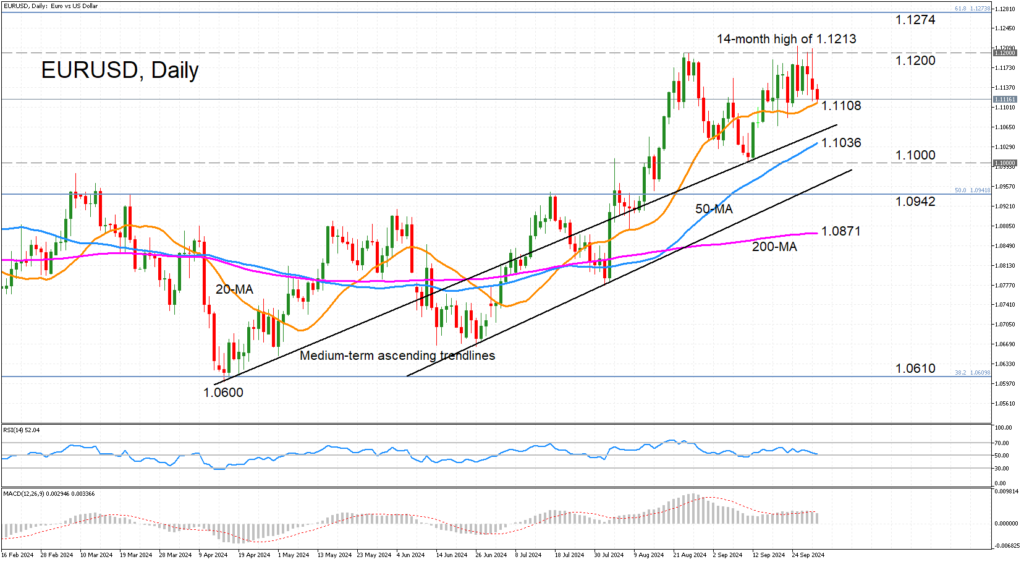
    EURUSD has retreated from last week’s 14-month high of 1.1213, erasing the short-term bullish bias. But the pair is so far managing to hold above the 20-day simple moving average (SMA) around 1.1108.

    The momentum indicators underscore the neutral picture in the near term as the RSI appears to be flatlining just above the 50 level, while the MACD has slipped just below its red signal line but remains comfortably in positive territory.

    The 20-day SMA is the nearest support barrier but a dip below it would switch the focus to the downside, and more specifically, to the upper ascending trendline. Slightly lower is the 50-day SMA at 1.1036. If these barriers fail, they would expose the 1.1000 level, which is the lower low from September – conceived between the double tops around 1.1200.

    A drop below 1.1000 would confirm the double-top pattern, which is a bearish signal, as well as undermine the bullish medium-term structure. However, the positive outlook is likely to stay intact as long as the price doesn’t breach the 200-day SMA at 1.0871, while ahead of that, the lower ascending trendline and the 50% Fibonacci retracement of the January 2021-September 2022 downleg at 1.0942 might come to the bulls’ defence.

    In the event that the price successfully rebounds off the 20-day SMA, the 1.1200 zone is likely to be tested again before aiming for the 61.8% Fibonacci of 1.1274, after which, attention would turn to the 1.1300 level.

    All in all, EURUSD still has a chance of resuming its medium-term uptrend, but the formation of a double-top pattern could scupper those prospects.

    Source by: XM Global

    Share. Facebook Twitter Pinterest LinkedIn Telegram WhatsApp Copy Link
    Previous ArticleDaily Comment – PCE inflation corroborates dovish Fed bets
    Next Article Daily Comment – Dollar gets a boost from Fed’s Powell but will the move last?

    Related Posts

    Technical Analysis

    Technical Analysis – USDJPY tests 158.00 level for first time in five months

    December 27, 2024
    Gold

    Technical Analysis – Gold returns above uptrend line

    December 23, 2024
    Technical Analysis

    Technical Analysis – USDCHF bulls are back and want to stay

    December 13, 2024
    Top Posts

    Get a Free Xmaster Formula Indicator Forex for MT4

    July 30, 2024102 Views

    Technical Analysis – ETHUSD trades flat after ETF debut

    July 25, 202446 Views

    Traders Dynamic Index (TDI): Best Strategies and Settings

    August 16, 202438 Views
    Stay In Touch
    • Facebook
    • YouTube
    • TikTok
    • WhatsApp
    • Twitter
    • Instagram

    Subscribe to Updates

    Get the latest tech news from FooBar about tech, design and biz.

    Most Popular

    Get a Free Xmaster Formula Indicator Forex for MT4

    July 30, 2024102 Views

    Technical Analysis – ETHUSD trades flat after ETF debut

    July 25, 202446 Views

    Traders Dynamic Index (TDI): Best Strategies and Settings

    August 16, 202438 Views
    Our Picks

    Technical Analysis – USDJPY tests 158.00 level for first time in five months

    December 27, 2024

    Daily Comment – Soft PCE inflation keeps rate cut hopes alive, but markets stay cautious

    December 23, 2024

    Technical Analysis – Gold returns above uptrend line

    December 23, 2024

    Subscribe to Updates

    Get the latest creative news from FooBar about art, design and business.

    Please enable JavaScript in your browser to complete this form.
    Loading
    © 2025 MyForexView.
    • Home
    • Analysis
    • Economic Calendar

    Type above and press Enter to search. Press Esc to cancel.