Close Menu
My Forex View

    Subscribe to Updates

    Get the latest creative news from FooBar about art, design and business.

    Please enable JavaScript in your browser to complete this form.
    Loading
    What's Hot

    Technical Analysis – USDJPY tests 158.00 level for first time in five months

    December 27, 2024

    Daily Comment – Soft PCE inflation keeps rate cut hopes alive, but markets stay cautious

    December 23, 2024

    Technical Analysis – Gold returns above uptrend line

    December 23, 2024
    Facebook X (Twitter) Instagram
    • Live Market
    • Learn Forex Trading
    • Technical Analysis
    Facebook X (Twitter) Instagram Pinterest Vimeo
    My Forex ViewMy Forex View
    • Home
    • Live Market
      • GBPUSD
      • EURUSD
      • USDJPY
      • XAUUSD
      • All Currency Pair
      • All Commodities Pair
    • Analysis
    • Free Forex Signals
    • Education
    • Tools
      • Economic Calendar
      • Currency Converter
      • Risk of Ruin Calculator
      • Pivot Points Calculator
      • Crypto Exchange Fees Calculator
      • Fibonacci Calculator
      • Forex Rebates
      • Margin Calculator
      • Compounding Calculator
      • Profit Calculator
      • Pip Calculator
      • Lot Size Calculator
      • Drawdown Calculator
    • Blog
    Join Telegram
    My Forex View
    Home » Technical Analysis – GBPJPY continues higher after UK CPI
    GBPJPY

    Technical Analysis – GBPJPY continues higher after UK CPI

    Christina ParthenidouBy Christina ParthenidouNovember 20, 2024No Comments2 Mins Read
    Facebook Twitter LinkedIn Pinterest Email
    • GBPJPY gains ground after upbeat UK CPI data
    • Technical signals endorse bullish efforts
    • Buyers need confirmation above 197.35

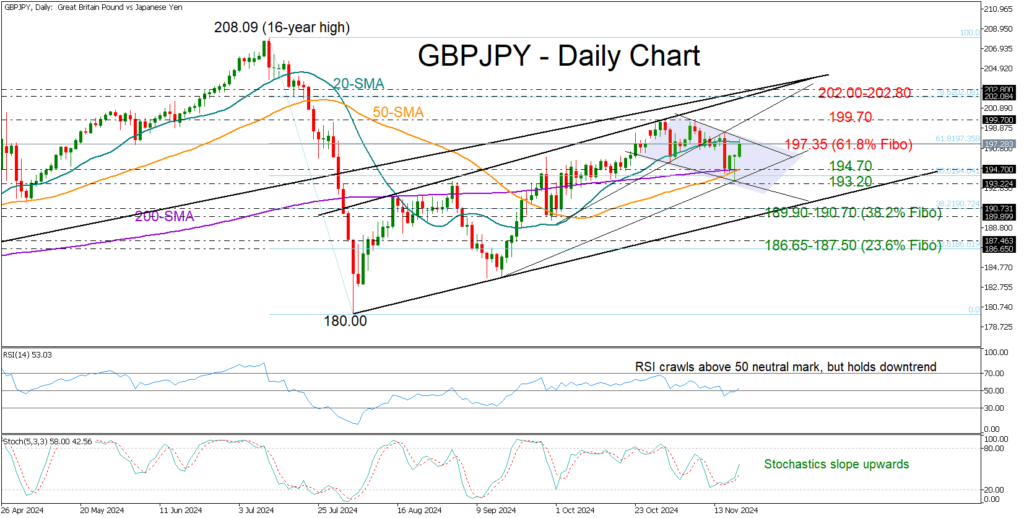
    GBPJPY advanced to an intra-day high of 197.77 after hotter-than-expected UK CPI inflation data gave traders confidence that the Bank of England might hold interest rates steady in December.

    Earlier, the pair had built a solid base around 194.70, supported by its 50- and 200-day simple moving averages. This suggests the upward pattern that started in August is still in play, despite November’s bearish tendencies.

    Looking at the technical indicators, the RSI and stochastic oscillator are endorsing the current euphoria in the market, but downside risks could remain in play if the price fails to close above the nearby resistance of 197.35, where the 20-day SMA and the 61.8% Fibonacci retracement level of the July-August downtrend are positioned. If the bulls can push past that border, they could next target October’s bar of 199.70, and beyond that, the 202.00-202.80 range.

    On the flip side, if the price steps below the 194.70 floor, the tentative falling line from October could halt selling forces near 193.20. If not, the decline could stretch toward the 38.2% Fibonacci mark of 190.70, and potentially reach the August support line at 189.90. Additional losses from there would violate the short-term uptrend, prompting a new decline toward the 186.65-187.50 zone.

    Overall, GBPJPY looks like it’s setting up a potential new bullish move, but traders will likely wait for a confirmation above 197.35 before jumping in.

    Share. Facebook Twitter Pinterest LinkedIn Telegram WhatsApp Copy Link
    Previous ArticleDaily Comment – Stocks cautiously edge up amid geopolitical and inflation risks
    Next Article Technical Analysis – NZDUSD falls to 1-year low ahead of RBNZ

    Related Posts

    Technical Analysis

    Technical Analysis – USDJPY tests 158.00 level for first time in five months

    December 27, 2024
    Gold

    Technical Analysis – Gold returns above uptrend line

    December 23, 2024
    Technical Analysis

    Technical Analysis – USDCHF bulls are back and want to stay

    December 13, 2024
    Top Posts

    Get a Free Xmaster Formula Indicator Forex for MT4

    July 30, 2024102 Views

    Technical Analysis – ETHUSD trades flat after ETF debut

    July 25, 202446 Views

    Traders Dynamic Index (TDI): Best Strategies and Settings

    August 16, 202438 Views
    Stay In Touch
    • Facebook
    • YouTube
    • TikTok
    • WhatsApp
    • Twitter
    • Instagram

    Subscribe to Updates

    Get the latest tech news from FooBar about tech, design and biz.

    Most Popular

    Get a Free Xmaster Formula Indicator Forex for MT4

    July 30, 2024102 Views

    Technical Analysis – ETHUSD trades flat after ETF debut

    July 25, 202446 Views

    Traders Dynamic Index (TDI): Best Strategies and Settings

    August 16, 202438 Views
    Our Picks

    Technical Analysis – USDJPY tests 158.00 level for first time in five months

    December 27, 2024

    Daily Comment – Soft PCE inflation keeps rate cut hopes alive, but markets stay cautious

    December 23, 2024

    Technical Analysis – Gold returns above uptrend line

    December 23, 2024

    Subscribe to Updates

    Get the latest creative news from FooBar about art, design and business.

    Please enable JavaScript in your browser to complete this form.
    Loading
    © 2025 MyForexView.
    • Home
    • Analysis
    • Economic Calendar

    Type above and press Enter to search. Press Esc to cancel.