Close Menu
My Forex View

    Subscribe to Updates

    Get the latest creative news from FooBar about art, design and business.

    Please enable JavaScript in your browser to complete this form.
    Loading
    What's Hot

    Technical Analysis – USDJPY tests 158.00 level for first time in five months

    December 27, 2024

    Daily Comment – Soft PCE inflation keeps rate cut hopes alive, but markets stay cautious

    December 23, 2024

    Technical Analysis – Gold returns above uptrend line

    December 23, 2024
    Facebook X (Twitter) Instagram
    • Live Market
    • Learn Forex Trading
    • Technical Analysis
    Facebook X (Twitter) Instagram Pinterest Vimeo
    My Forex ViewMy Forex View
    • Home
    • Live Market
      • GBPUSD
      • EURUSD
      • USDJPY
      • XAUUSD
      • All Currency Pair
      • All Commodities Pair
    • Analysis
    • Free Forex Signals
    • Education
    • Tools
      • Economic Calendar
      • Currency Converter
      • Risk of Ruin Calculator
      • Pivot Points Calculator
      • Crypto Exchange Fees Calculator
      • Fibonacci Calculator
      • Forex Rebates
      • Margin Calculator
      • Compounding Calculator
      • Profit Calculator
      • Pip Calculator
      • Lot Size Calculator
      • Drawdown Calculator
    • Blog
    Join Telegram
    My Forex View
    Home » Technical Analysis – GBPJPY extends decline to a fresh 2-month low
    GBPJPY

    Technical Analysis – GBPJPY extends decline to a fresh 2-month low

    Stefanos OikonomidisBy Stefanos OikonomidisJuly 26, 2024Updated:November 7, 2024No Comments2 Mins Read
    Facebook Twitter LinkedIn Pinterest Email
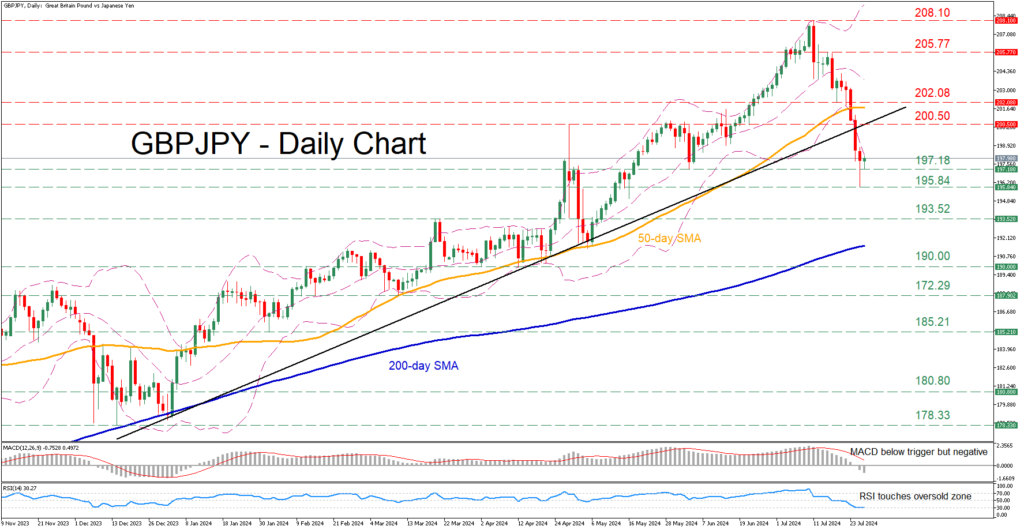
    • GBPJPY pulls back from its 16-year peak of 208.10
    • The pair falls to its lowest level since May 16
    • RSI and MACD warn of an overstretched retreat

    GBPJPY has been in a prolonged uptrend since early 2024, posting a 16-year high of 208.10 on July 11. However, the pair has been undergoing a pullback since then, with the price violating both the supportive trendline in place since January and the 50-day simple moving average (SMA).

    Should the bears attempt to push the price lower, they would have to initially clear the June low of 197.18 before attention shifts to the recent two-month bottom of 195.84. Failing to halt there, the pair might challenge the March resistance of 193.52. Further declines could then cease at the 190.00 psychological mark, which provided strong support in April.

    Alternatively, if the price edges back higher, the April peak of 200.50 may prove to be the first barrier for the bulls to overcome. Piercing through that wall, the price could advance towards 202.08 before it faces the July resistance of 205.77. A violation of the latter might set the stage for the 16-year high of 208.10.

    In brief, GBPJPY has been experiencing a downside correction from its recent multi-year high, with the break below the crucial ascending trendline further darkening the technical picture. However, the bears should be cautious as the short-term oscillators are flagging overbought conditions.

    Source by: XM Global

    Share. Facebook Twitter Pinterest LinkedIn Telegram WhatsApp Copy Link
    Previous ArticleMidweek Technical Look – USDJPY, GBPUSD, EURGBP
    Next Article Technical Analysis – USDCAD eases after aggressive rally to 1.3845

    Related Posts

    Technical Analysis

    Technical Analysis – USDJPY tests 158.00 level for first time in five months

    December 27, 2024
    Gold

    Technical Analysis – Gold returns above uptrend line

    December 23, 2024
    Technical Analysis

    Technical Analysis – USDCHF bulls are back and want to stay

    December 13, 2024
    Top Posts

    Get a Free Xmaster Formula Indicator Forex for MT4

    July 30, 2024102 Views

    Technical Analysis – ETHUSD trades flat after ETF debut

    July 25, 202446 Views

    Traders Dynamic Index (TDI): Best Strategies and Settings

    August 16, 202438 Views
    Stay In Touch
    • Facebook
    • YouTube
    • TikTok
    • WhatsApp
    • Twitter
    • Instagram

    Subscribe to Updates

    Get the latest tech news from FooBar about tech, design and biz.

    Most Popular

    Get a Free Xmaster Formula Indicator Forex for MT4

    July 30, 2024102 Views

    Technical Analysis – ETHUSD trades flat after ETF debut

    July 25, 202446 Views

    Traders Dynamic Index (TDI): Best Strategies and Settings

    August 16, 202438 Views
    Our Picks

    Technical Analysis – USDJPY tests 158.00 level for first time in five months

    December 27, 2024

    Daily Comment – Soft PCE inflation keeps rate cut hopes alive, but markets stay cautious

    December 23, 2024

    Technical Analysis – Gold returns above uptrend line

    December 23, 2024

    Subscribe to Updates

    Get the latest creative news from FooBar about art, design and business.

    Please enable JavaScript in your browser to complete this form.
    Loading
    © 2025 MyForexView.
    • Home
    • Analysis
    • Economic Calendar

    Type above and press Enter to search. Press Esc to cancel.