Close Menu
My Forex View

    Subscribe to Updates

    Get the latest creative news from FooBar about art, design and business.

    Please enable JavaScript in your browser to complete this form.
    Loading
    What's Hot

    Technical Analysis – USDJPY tests 158.00 level for first time in five months

    December 27, 2024

    Daily Comment – Soft PCE inflation keeps rate cut hopes alive, but markets stay cautious

    December 23, 2024

    Technical Analysis – Gold returns above uptrend line

    December 23, 2024
    Facebook X (Twitter) Instagram
    • Live Market
    • Learn Forex Trading
    • Technical Analysis
    Facebook X (Twitter) Instagram Pinterest Vimeo
    My Forex ViewMy Forex View
    • Home
    • Live Market
      • GBPUSD
      • EURUSD
      • USDJPY
      • XAUUSD
      • All Currency Pair
      • All Commodities Pair
    • Analysis
    • Free Forex Signals
    • Education
    • Tools
      • Economic Calendar
      • Currency Converter
      • Risk of Ruin Calculator
      • Pivot Points Calculator
      • Crypto Exchange Fees Calculator
      • Fibonacci Calculator
      • Forex Rebates
      • Margin Calculator
      • Compounding Calculator
      • Profit Calculator
      • Pip Calculator
      • Lot Size Calculator
      • Drawdown Calculator
    • Blog
    Join Telegram
    My Forex View
    Home » Technical Analysis – GBPUSD awaits strong resistance near 1-year high
    GBPUSD

    Technical Analysis – GBPUSD awaits strong resistance near 1-year high

    Melina DeltasBy Melina DeltasAugust 20, 2024Updated:November 7, 2024No Comments2 Mins Read
    Facebook Twitter LinkedIn Pinterest Email
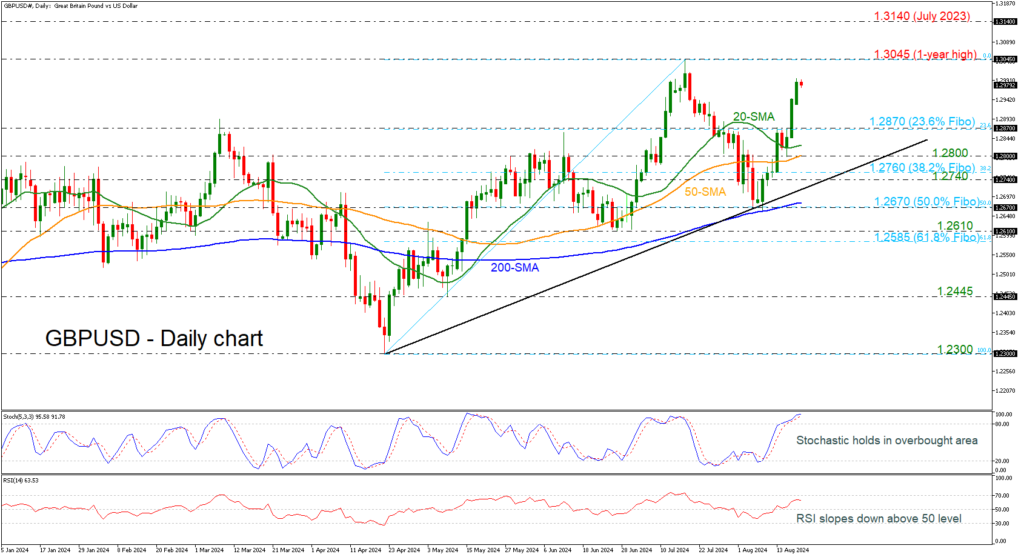
    • GBP USD’s rebound off 200-day SMA still holds
    • Stochastic in the overbought area
    • RSI ticks south above the 50 level

    GBPUSD continues last week’s rebound off the 200-day SMA and the 50.0% Fibonacci retracement level of the up leg from 1.2300 to 1.3045 at 1.2670 but with some weakness today. The intraday bias looks neutral to negative, as the stochastic is still standing above the 80 levels but is losing some steam, while the RSI, although above 50, seems to be making its way down.

    If the pair manages to head higher, the one-year high of 1.3045 could serve as a trigger point for steeper bullish action. Further north, the cable could run toward the 1.3140 level, a strong barrier from last year.

    However, if the pair reverses to the downside, investors could move first at the 23.6% Fibonacci of 1.2870 before meeting the 20- and then the 50-day simple moving averages (SMAs) at 1.2825 and 1.2800 respectively. If the price continues to drop, support could next come somewhere between the uptrend line and the 38.2% Fibonacci of 1.2760.

    In the medium-term picture, the bounce off 1.2300 turned the outlook from neutral to bullish. Chances for another bullish move are still rising as the 200-day SMA keeps rising.

    Source by: XM Global

    Share. Facebook Twitter Pinterest LinkedIn Telegram WhatsApp Copy Link
    Previous ArticleUnderstanding the Cup and Handle Pattern
    Next Article Market Comment – Dollar under pressure ahead of Jackson Hole Symposium

    Related Posts

    GBPUSD

    Technical Analysis – GBPUSD is capped by 200-day SMA

    December 10, 2024
    GBPUSD

    Technical Analysis – GBPUSD shows signs of positive momentum

    December 5, 2024
    GBPUSD

    Technical Analysis – GBPUSD gains traction near familiar support area

    November 19, 2024
    Top Posts

    Get a Free Xmaster Formula Indicator Forex for MT4

    July 30, 2024102 Views

    Technical Analysis – ETHUSD trades flat after ETF debut

    July 25, 202446 Views

    Traders Dynamic Index (TDI): Best Strategies and Settings

    August 16, 202436 Views
    Stay In Touch
    • Facebook
    • YouTube
    • TikTok
    • WhatsApp
    • Twitter
    • Instagram

    Subscribe to Updates

    Get the latest tech news from FooBar about tech, design and biz.

    Most Popular

    Get a Free Xmaster Formula Indicator Forex for MT4

    July 30, 2024102 Views

    Technical Analysis – ETHUSD trades flat after ETF debut

    July 25, 202446 Views

    Traders Dynamic Index (TDI): Best Strategies and Settings

    August 16, 202436 Views
    Our Picks

    Technical Analysis – USDJPY tests 158.00 level for first time in five months

    December 27, 2024

    Daily Comment – Soft PCE inflation keeps rate cut hopes alive, but markets stay cautious

    December 23, 2024

    Technical Analysis – Gold returns above uptrend line

    December 23, 2024

    Subscribe to Updates

    Get the latest creative news from FooBar about art, design and business.

    Please enable JavaScript in your browser to complete this form.
    Loading
    © 2025 MyForexView.
    • Home
    • Analysis
    • Economic Calendar

    Type above and press Enter to search. Press Esc to cancel.