Close Menu
My Forex View

    Subscribe to Updates

    Get the latest creative news from FooBar about art, design and business.

    Please enable JavaScript in your browser to complete this form.
    Loading
    What's Hot

    Technical Analysis – USDJPY tests 158.00 level for first time in five months

    December 27, 2024

    Daily Comment – Soft PCE inflation keeps rate cut hopes alive, but markets stay cautious

    December 23, 2024

    Technical Analysis – Gold returns above uptrend line

    December 23, 2024
    Facebook X (Twitter) Instagram
    • Live Market
    • Learn Forex Trading
    • Technical Analysis
    Facebook X (Twitter) Instagram Pinterest Vimeo
    My Forex ViewMy Forex View
    • Home
    • Live Market
      • GBPUSD
      • EURUSD
      • USDJPY
      • XAUUSD
      • All Currency Pair
      • All Commodities Pair
    • Analysis
    • Free Forex Signals
    • Education
    • Tools
      • Economic Calendar
      • Currency Converter
      • Risk of Ruin Calculator
      • Pivot Points Calculator
      • Crypto Exchange Fees Calculator
      • Fibonacci Calculator
      • Forex Rebates
      • Margin Calculator
      • Compounding Calculator
      • Profit Calculator
      • Pip Calculator
      • Lot Size Calculator
      • Drawdown Calculator
    • Blog
    Join Telegram
    My Forex View
    Home » Technical Analysis – GBPUSD gains traction near familiar support area
    GBPUSD

    Technical Analysis – GBPUSD gains traction near familiar support area

    Christina ParthenidouBy Christina ParthenidouNovember 19, 2024No Comments2 Mins Read
    Facebook Twitter LinkedIn Pinterest Email
    • GBPUSD bulls step in after six-month low near 1.2600
    • Price near oversold area, but bullish area is above 1.3000


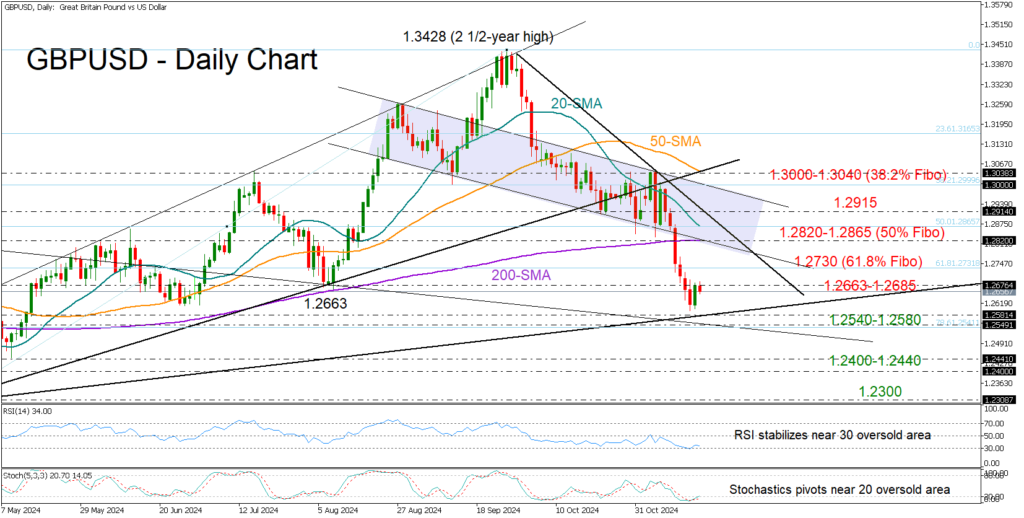
    GBPUSD returned to gains after a six-day decline squeezed it to a six-month low of 1.2595. The pair rebounded near an important trendline from October 2023, and indicators like the RSI and stochastic oscillator suggest the price is likely set for an upward move from oversold territory.

    Yet, buyers may not make additional moves until the price clearly crawls back above August’s base of 1.2663-1.2685. The 1.2730 bar, which overlaps with the 61.8% Fibonacci retracement of the April-September upleg, could be another hurdle before the 200-day simple moving average (SMA) and the 50% Fibonacci mark of 1.2865 come into view. If the tentative resistance line gives way at 1.2915, the bulls could accelerate toward the critical 1.3000-1.3040 constraining zone with scope to change the trend back to positive.

    In the bearish scenario where the pair slips below the 1.2540-1.2580 floor, a sharp decline could occur toward 1.2400-1.2440. The 1.2300 round number, which almost triggered April’s rally, may resume its supportive role if selling pressure intensifies.

    In summary, GBPUSD seems poised for a potential recovery, but a clear break above 1.2663-1.2685 is needed to confirm additional gains.

    Share. Facebook Twitter Pinterest LinkedIn Telegram WhatsApp Copy Link
    Previous ArticleTechnical Analysis – EURJPY correction halts at key support area
    Next Article Daily Comment – Stocks cautiously edge up amid geopolitical and inflation risks

    Related Posts

    GBPUSD

    Technical Analysis – GBPUSD is capped by 200-day SMA

    December 10, 2024
    GBPUSD

    Technical Analysis – GBPUSD shows signs of positive momentum

    December 5, 2024
    GBPUSD

    Technical Analysis – GBPUSD: One more burst of strength?

    October 23, 2024
    Top Posts

    Get a Free Xmaster Formula Indicator Forex for MT4

    July 30, 2024102 Views

    Technical Analysis – ETHUSD trades flat after ETF debut

    July 25, 202446 Views

    Traders Dynamic Index (TDI): Best Strategies and Settings

    August 16, 202436 Views
    Stay In Touch
    • Facebook
    • YouTube
    • TikTok
    • WhatsApp
    • Twitter
    • Instagram

    Subscribe to Updates

    Get the latest tech news from FooBar about tech, design and biz.

    Most Popular

    Get a Free Xmaster Formula Indicator Forex for MT4

    July 30, 2024102 Views

    Technical Analysis – ETHUSD trades flat after ETF debut

    July 25, 202446 Views

    Traders Dynamic Index (TDI): Best Strategies and Settings

    August 16, 202436 Views
    Our Picks

    Technical Analysis – USDJPY tests 158.00 level for first time in five months

    December 27, 2024

    Daily Comment – Soft PCE inflation keeps rate cut hopes alive, but markets stay cautious

    December 23, 2024

    Technical Analysis – Gold returns above uptrend line

    December 23, 2024

    Subscribe to Updates

    Get the latest creative news from FooBar about art, design and business.

    Please enable JavaScript in your browser to complete this form.
    Loading
    © 2025 MyForexView.
    • Home
    • Analysis
    • Economic Calendar

    Type above and press Enter to search. Press Esc to cancel.