Close Menu
My Forex View

    Subscribe to Updates

    Get the latest creative news from FooBar about art, design and business.

    Please enable JavaScript in your browser to complete this form.
    Loading
    What's Hot

    Technical Analysis – USDJPY tests 158.00 level for first time in five months

    December 27, 2024

    Daily Comment – Soft PCE inflation keeps rate cut hopes alive, but markets stay cautious

    December 23, 2024

    Technical Analysis – Gold returns above uptrend line

    December 23, 2024
    Facebook X (Twitter) Instagram
    • Live Market
    • Learn Forex Trading
    • Technical Analysis
    Facebook X (Twitter) Instagram Pinterest Vimeo
    My Forex ViewMy Forex View
    • Home
    • Live Market
      • GBPUSD
      • EURUSD
      • USDJPY
      • XAUUSD
      • All Currency Pair
      • All Commodities Pair
    • Analysis
    • Free Forex Signals
    • Education
    • Tools
      • Economic Calendar
      • Currency Converter
      • Risk of Ruin Calculator
      • Pivot Points Calculator
      • Crypto Exchange Fees Calculator
      • Fibonacci Calculator
      • Forex Rebates
      • Margin Calculator
      • Compounding Calculator
      • Profit Calculator
      • Pip Calculator
      • Lot Size Calculator
      • Drawdown Calculator
    • Blog
    Join Telegram
    My Forex View
    Home » Technical Analysis – GBPUSD is capped by 200-day SMA
    GBPUSD

    Technical Analysis – GBPUSD is capped by 200-day SMA

    Melina DeltasBy Melina DeltasDecember 10, 2024No Comments1 Min Read
    Facebook Twitter LinkedIn Pinterest Email
    • GBPUSD remains in negative area
    • But holds beyond the downtrend line
    • RSI and MACD give some optimistic views

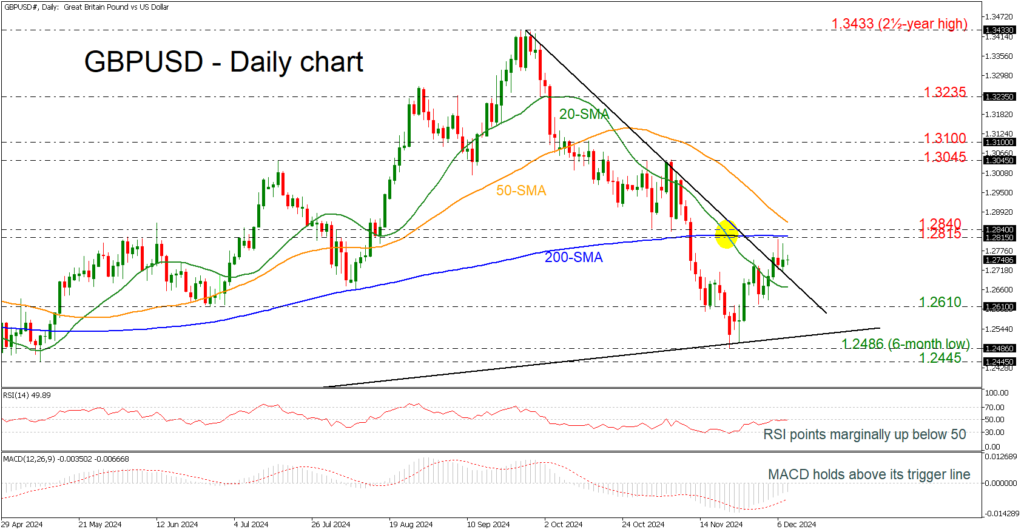
    GBPUSD is experiencing a new bullish attempt to remain above the short-term descending trend line, but the 200-day simple moving average (SMA) at 1.2815 appears to be a tough obstacle for traders.

    If the market overcomes the aforementioned barrier, then immediate resistance would come from the inside swing lows at 1.2840.  Should the price move above the 50-day SMA at 1.2870, it could spark optimism among the bulls. The 1.3045 and the 1.3100 resistance levels may endorse the bullish retracement in the short-term view.

    On the other hand, a drop below the downtrend line again would endorse the negative structure, testing the 20-day SMA at 1.2670 before meeting the previous low near 1.2610.

    The technical oscillators show some optimism for further increases. The RSI is battling with the neutral threshold of 50, while the MACD remains well above its trigger line below the zero level.

    All in all, GBPUSD is still in bearish territory, especially after the failed attempt to surpass the 200-day SMA.

    Share. Facebook Twitter Pinterest LinkedIn Telegram WhatsApp Copy Link
    Previous ArticleWeekly Technical Outlook – USDJPY, EURUSD, USDCAD
    Next Article Technical Analysis – AUDUSD flips back to recent lows after RBA’s decision

    Related Posts

    GBPUSD

    Technical Analysis – GBPUSD shows signs of positive momentum

    December 5, 2024
    GBPUSD

    Technical Analysis – GBPUSD gains traction near familiar support area

    November 19, 2024
    GBPUSD

    Technical Analysis – GBPUSD: One more burst of strength?

    October 23, 2024
    Top Posts

    Get a Free Xmaster Formula Indicator Forex for MT4

    July 30, 2024102 Views

    Technical Analysis – ETHUSD trades flat after ETF debut

    July 25, 202446 Views

    Traders Dynamic Index (TDI): Best Strategies and Settings

    August 16, 202436 Views
    Stay In Touch
    • Facebook
    • YouTube
    • TikTok
    • WhatsApp
    • Twitter
    • Instagram

    Subscribe to Updates

    Get the latest tech news from FooBar about tech, design and biz.

    Most Popular

    Get a Free Xmaster Formula Indicator Forex for MT4

    July 30, 2024102 Views

    Technical Analysis – ETHUSD trades flat after ETF debut

    July 25, 202446 Views

    Traders Dynamic Index (TDI): Best Strategies and Settings

    August 16, 202436 Views
    Our Picks

    Technical Analysis – USDJPY tests 158.00 level for first time in five months

    December 27, 2024

    Daily Comment – Soft PCE inflation keeps rate cut hopes alive, but markets stay cautious

    December 23, 2024

    Technical Analysis – Gold returns above uptrend line

    December 23, 2024

    Subscribe to Updates

    Get the latest creative news from FooBar about art, design and business.

    Please enable JavaScript in your browser to complete this form.
    Loading
    © 2025 MyForexView.
    • Home
    • Analysis
    • Economic Calendar

    Type above and press Enter to search. Press Esc to cancel.