Close Menu
My Forex View

    Subscribe to Updates

    Get the latest creative news from FooBar about art, design and business.

    Please enable JavaScript in your browser to complete this form.
    Loading
    What's Hot

    Technical Analysis – USDJPY tests 158.00 level for first time in five months

    December 27, 2024

    Daily Comment – Soft PCE inflation keeps rate cut hopes alive, but markets stay cautious

    December 23, 2024

    Technical Analysis – Gold returns above uptrend line

    December 23, 2024
    Facebook X (Twitter) Instagram
    • Live Market
    • Learn Forex Trading
    • Technical Analysis
    Facebook X (Twitter) Instagram Pinterest Vimeo
    My Forex ViewMy Forex View
    • Home
    • Live Market
      • GBPUSD
      • EURUSD
      • USDJPY
      • XAUUSD
      • All Currency Pair
      • All Commodities Pair
    • Analysis
    • Free Forex Signals
    • Education
    • Tools
      • Economic Calendar
      • Currency Converter
      • Risk of Ruin Calculator
      • Pivot Points Calculator
      • Crypto Exchange Fees Calculator
      • Fibonacci Calculator
      • Forex Rebates
      • Margin Calculator
      • Compounding Calculator
      • Profit Calculator
      • Pip Calculator
      • Lot Size Calculator
      • Drawdown Calculator
    • Blog
    Join Telegram
    My Forex View
    Home » Technical Analysis – GBPUSD: Is the next downturn approaching?
    GBPUSD

    Technical Analysis – GBPUSD: Is the next downturn approaching?

    Christina ParthenidouBy Christina ParthenidouAugust 27, 2024Updated:November 7, 2024No Comments2 Mins Read
    Facebook Twitter LinkedIn Pinterest Email
    • GBP USD’s bull run slows down near a familiar resistance area
    • Some stability is likely; sellers need a close below 1.3188 to gain control

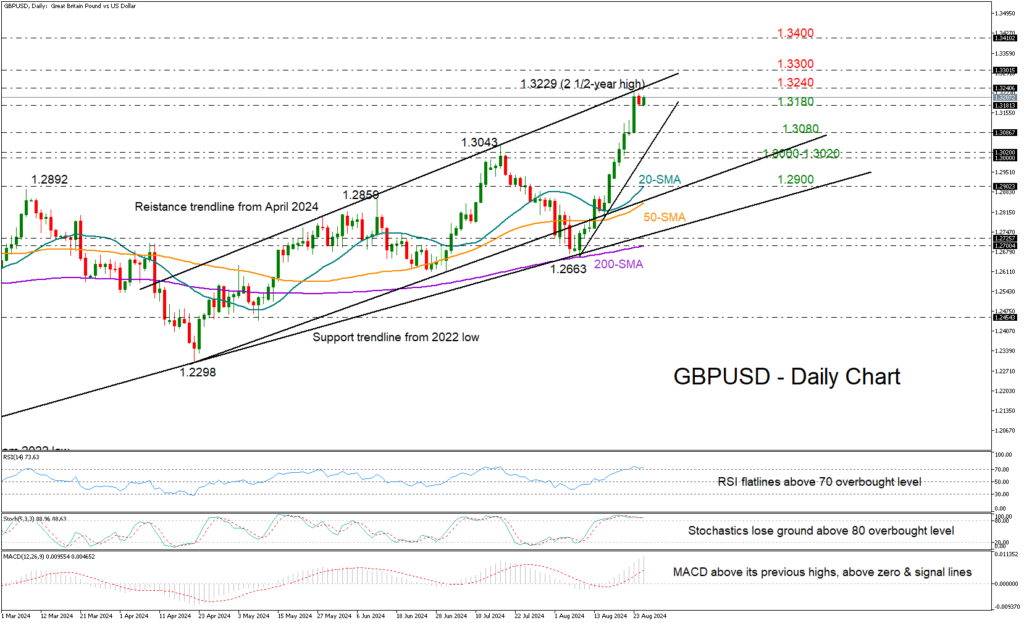
    GBPUSD opened the week with marginal losses after its almost uninterrupted two-week rally was rejected near the key resistance trendline at 1.3229 for the third time.

    While the bulls are trying to make a comeback today, the RSI and Stochastic oscillator are both flatlining in the overbought zone, indicating a high risk of a downside correction.

    Perhaps, a step below the 1.3180 area, which has been acting as support for the second consecutive day, could confirm additional losses towards the 1.3025-1.3085 zone. If the steep ascending trendline from August’s lows is broken along with the 1.3000 psychological mark too, it could lead to a rapid decline towards the 20- and 50-day simple moving averages (SMA) found between 1.2890-1.2900.

    Regarding resistance levels, the ascending trendline from April will be closely watched near 1.3240. A move above it could reach the 1.3300 round level, while higher, the bulls will set their sights near the 1.3400 mark last seen in March 2022.

    Overall, following its recent swift appreciation, GBPUSD could undergo profit-taking. However, as long as the pair continues its upward trend in the medium-term picture, investors won’t be concerned unless the price falls below 1.2700-1.2730.

    Source by: XM Global

    Share. Facebook Twitter Pinterest LinkedIn Telegram WhatsApp Copy Link
    Previous ArticleTechnical Analysis – US 500 cash index flirts with previous all-time high
    Next Article Technical Analysis – USDJPY gets assistance from 143.40 support

    Related Posts

    GBPUSD

    Technical Analysis – GBPUSD is capped by 200-day SMA

    December 10, 2024
    GBPUSD

    Technical Analysis – GBPUSD shows signs of positive momentum

    December 5, 2024
    GBPUSD

    Technical Analysis – GBPUSD gains traction near familiar support area

    November 19, 2024
    Top Posts

    Get a Free Xmaster Formula Indicator Forex for MT4

    July 30, 2024102 Views

    Technical Analysis – ETHUSD trades flat after ETF debut

    July 25, 202446 Views

    Traders Dynamic Index (TDI): Best Strategies and Settings

    August 16, 202438 Views
    Stay In Touch
    • Facebook
    • YouTube
    • TikTok
    • WhatsApp
    • Twitter
    • Instagram

    Subscribe to Updates

    Get the latest tech news from FooBar about tech, design and biz.

    Most Popular

    Get a Free Xmaster Formula Indicator Forex for MT4

    July 30, 2024102 Views

    Technical Analysis – ETHUSD trades flat after ETF debut

    July 25, 202446 Views

    Traders Dynamic Index (TDI): Best Strategies and Settings

    August 16, 202438 Views
    Our Picks

    Technical Analysis – USDJPY tests 158.00 level for first time in five months

    December 27, 2024

    Daily Comment – Soft PCE inflation keeps rate cut hopes alive, but markets stay cautious

    December 23, 2024

    Technical Analysis – Gold returns above uptrend line

    December 23, 2024

    Subscribe to Updates

    Get the latest creative news from FooBar about art, design and business.

    Please enable JavaScript in your browser to complete this form.
    Loading
    © 2025 MyForexView.
    • Home
    • Analysis
    • Economic Calendar

    Type above and press Enter to search. Press Esc to cancel.