Close Menu
My Forex View

    Subscribe to Updates

    Get the latest creative news from FooBar about art, design and business.

    Please enable JavaScript in your browser to complete this form.
    Loading
    What's Hot

    Technical Analysis – USDJPY tests 158.00 level for first time in five months

    December 27, 2024

    Daily Comment – Soft PCE inflation keeps rate cut hopes alive, but markets stay cautious

    December 23, 2024

    Technical Analysis – Gold returns above uptrend line

    December 23, 2024
    Facebook X (Twitter) Instagram
    • Live Market
    • Learn Forex Trading
    • Technical Analysis
    Facebook X (Twitter) Instagram Pinterest Vimeo
    My Forex ViewMy Forex View
    • Home
    • Live Market
      • GBPUSD
      • EURUSD
      • USDJPY
      • XAUUSD
      • All Currency Pair
      • All Commodities Pair
    • Analysis
    • Free Forex Signals
    • Education
    • Tools
      • Economic Calendar
      • Currency Converter
      • Risk of Ruin Calculator
      • Pivot Points Calculator
      • Crypto Exchange Fees Calculator
      • Fibonacci Calculator
      • Forex Rebates
      • Margin Calculator
      • Compounding Calculator
      • Profit Calculator
      • Pip Calculator
      • Lot Size Calculator
      • Drawdown Calculator
    • Blog
    Join Telegram
    My Forex View
    Home » Technical Analysis – GBPUSD loses 3% from 2½-year high
    GBPUSD

    Technical Analysis – GBPUSD loses 3% from 2½-year high

    Melina DeltasBy Melina DeltasOctober 8, 2024Updated:November 7, 2024No Comments2 Mins Read
    Facebook Twitter LinkedIn Pinterest Email
    • GBPUSD stops near 1.3100
    • Momentum oscillators suggest upside recovery

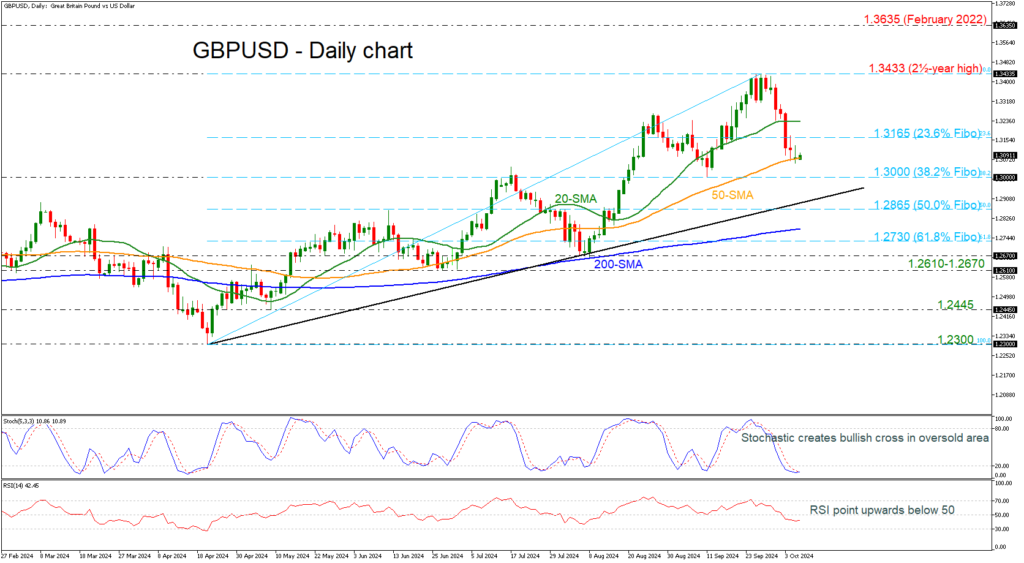
    GBPUSD is pausing its downward wave that started from the two-and-a-half-year high of 1.3433, hovering near the 50-day simple moving average (SMA) marginally beneath the 1.3100 round level.  

    The pair has lost around 3%, with the technical oscillators indicating the end of the southward move. The stochastic posting a bullish crossover within its %K and %D lines in the oversold area and the RSI pointing up beneath the 50 territory.

    Should the pair manage to strengthen its positive momentum, the next resistance could come around the 23.6% Fibonacci retracement level of the up leg from 1.2300 to 1.3433 at 1.3165. Slightly higher, the 20-day SMA at 1.3235 is coming next and any break above the 1.3433 top would shift the bias to a more bullish one and open the way towards the February 2022 peak at 1.3635.

    However, if prices are unable to break the 23.6% Fibo level in the next few sessions, the risk would shift back to the downside, with the 38.2% Fibonacci at 1.3000, which is a key level for traders, coming into focus. A drop below this mark, would take the market towards the medium-term uptrend line and the 50.0% Fibonacci of 1.3865.

    In the bigger picture, the pair is bullish as long as it holds above the 200-day SMA and the ascending trend line.  In case it violates these lines, the bears could gain the upper hand. 

    Source by: XM Global

    Share. Facebook Twitter Pinterest LinkedIn Telegram WhatsApp Copy Link
    Previous ArticleDaily Comment – Dollar stands tall after robust jobs report
    Next Article Technical Analysis – AUDJPY in the red again

    Related Posts

    GBPUSD

    Technical Analysis – GBPUSD is capped by 200-day SMA

    December 10, 2024
    GBPUSD

    Technical Analysis – GBPUSD shows signs of positive momentum

    December 5, 2024
    GBPUSD

    Technical Analysis – GBPUSD gains traction near familiar support area

    November 19, 2024
    Top Posts

    Get a Free Xmaster Formula Indicator Forex for MT4

    July 30, 2024103 Views

    Technical Analysis – ETHUSD trades flat after ETF debut

    July 25, 202446 Views

    Traders Dynamic Index (TDI): Best Strategies and Settings

    August 16, 202441 Views
    Stay In Touch
    • Facebook
    • YouTube
    • TikTok
    • WhatsApp
    • Twitter
    • Instagram

    Subscribe to Updates

    Get the latest tech news from FooBar about tech, design and biz.

    Most Popular

    Get a Free Xmaster Formula Indicator Forex for MT4

    July 30, 2024103 Views

    Technical Analysis – ETHUSD trades flat after ETF debut

    July 25, 202446 Views

    Traders Dynamic Index (TDI): Best Strategies and Settings

    August 16, 202441 Views
    Our Picks

    Technical Analysis – USDJPY tests 158.00 level for first time in five months

    December 27, 2024

    Daily Comment – Soft PCE inflation keeps rate cut hopes alive, but markets stay cautious

    December 23, 2024

    Technical Analysis – Gold returns above uptrend line

    December 23, 2024

    Subscribe to Updates

    Get the latest creative news from FooBar about art, design and business.

    Please enable JavaScript in your browser to complete this form.
    Loading
    © 2025 MyForexView.
    • Home
    • Analysis
    • Economic Calendar

    Type above and press Enter to search. Press Esc to cancel.