Close Menu
My Forex View

    Subscribe to Updates

    Get the latest creative news from FooBar about art, design and business.

    Please enable JavaScript in your browser to complete this form.
    Loading
    What's Hot

    Technical Analysis – USDJPY tests 158.00 level for first time in five months

    December 27, 2024

    Daily Comment – Soft PCE inflation keeps rate cut hopes alive, but markets stay cautious

    December 23, 2024

    Technical Analysis – Gold returns above uptrend line

    December 23, 2024
    Facebook X (Twitter) Instagram
    • Live Market
    • Learn Forex Trading
    • Technical Analysis
    Facebook X (Twitter) Instagram Pinterest Vimeo
    My Forex ViewMy Forex View
    • Home
    • Live Market
      • GBPUSD
      • EURUSD
      • USDJPY
      • XAUUSD
      • All Currency Pair
      • All Commodities Pair
    • Analysis
    • Free Forex Signals
    • Education
    • Tools
      • Economic Calendar
      • Currency Converter
      • Risk of Ruin Calculator
      • Pivot Points Calculator
      • Crypto Exchange Fees Calculator
      • Fibonacci Calculator
      • Forex Rebates
      • Margin Calculator
      • Compounding Calculator
      • Profit Calculator
      • Pip Calculator
      • Lot Size Calculator
      • Drawdown Calculator
    • Blog
    Join Telegram
    My Forex View
    Home » Technical Analysis – GBPUSD on a slippery slope
    GBPUSD

    Technical Analysis – GBPUSD on a slippery slope

    Melina DeltasBy Melina DeltasSeptember 10, 2024Updated:November 7, 2024No Comments1 Min Read
    Facebook Twitter LinkedIn Pinterest Email
    •  GBPUSD hovers within critical zone
    • Stochastics and RSI lose momentum

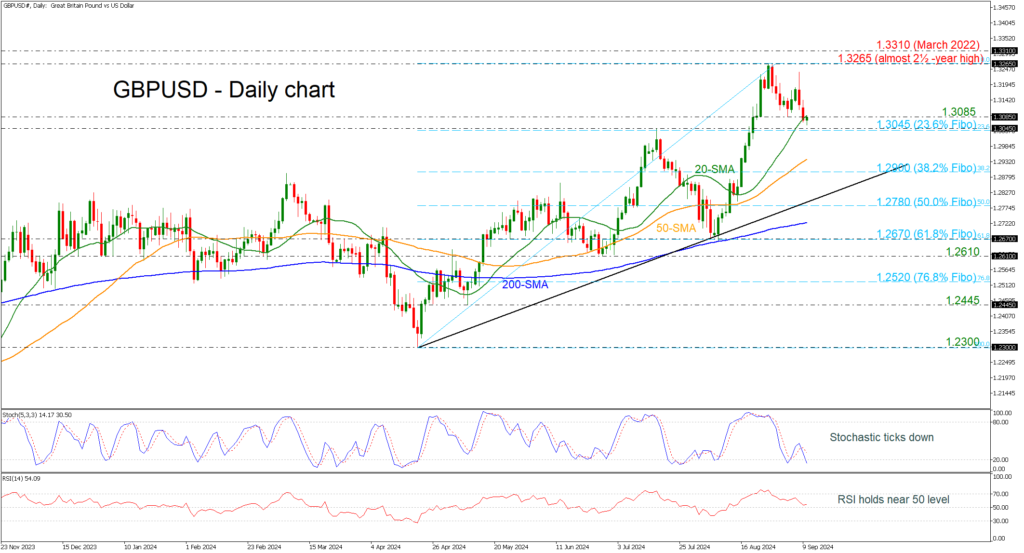
    GBPUSD has lost its positive momentum after the pullback on the almost two-and-a-half-year high of 1.3265, trading within the restrictive support area of 1.3045-1.3085, which encapsulates the 23.6% Fibonacci retracement level of the upward wave from 1.2300 to 1.3265.

    In the short term, the market could maintain downside risks if the RSI keeps moving around the neutral threshold of 50 and the stochastic continues to move in the oversold territory.

    If the pair weakens further, the 50-day simple moving average (SMA) at 1.2940 could provide immediate support ahead of the 38.2% Fibonacci at 1.2900. Even lower, the 50.0% Fibonacci at 1.2780 may attract more attention, as any leg lower could worsen the market’s outlook, opening the way for a bearish bias.

    On the other hand, an extension to the upside could meet the area within the 1.3265 peak and the March 2022 top at 1.3310.

    To summarize, GBPUSD looks neutral to bearish in the very short-term window; however, the broader picture is strongly positive as long as the market remains well above the medium-term ascending trend line.

    Source by: XM Global

    Share. Facebook Twitter Pinterest LinkedIn Telegram WhatsApp Copy Link
    Previous ArticleDaily Comment – Dollar and equities rebound from NFP-led losses as focus turns to US CPI
    Next Article Daily Comment – Equities rebound but face danger from US presidential debate

    Related Posts

    GBPUSD

    Technical Analysis – GBPUSD is capped by 200-day SMA

    December 10, 2024
    GBPUSD

    Technical Analysis – GBPUSD shows signs of positive momentum

    December 5, 2024
    GBPUSD

    Technical Analysis – GBPUSD gains traction near familiar support area

    November 19, 2024
    Top Posts

    Get a Free Xmaster Formula Indicator Forex for MT4

    July 30, 2024102 Views

    Technical Analysis – ETHUSD trades flat after ETF debut

    July 25, 202446 Views

    Traders Dynamic Index (TDI): Best Strategies and Settings

    August 16, 202435 Views
    Stay In Touch
    • Facebook
    • YouTube
    • TikTok
    • WhatsApp
    • Twitter
    • Instagram

    Subscribe to Updates

    Get the latest tech news from FooBar about tech, design and biz.

    Most Popular

    Get a Free Xmaster Formula Indicator Forex for MT4

    July 30, 2024102 Views

    Technical Analysis – ETHUSD trades flat after ETF debut

    July 25, 202446 Views

    Traders Dynamic Index (TDI): Best Strategies and Settings

    August 16, 202435 Views
    Our Picks

    Technical Analysis – USDJPY tests 158.00 level for first time in five months

    December 27, 2024

    Daily Comment – Soft PCE inflation keeps rate cut hopes alive, but markets stay cautious

    December 23, 2024

    Technical Analysis – Gold returns above uptrend line

    December 23, 2024

    Subscribe to Updates

    Get the latest creative news from FooBar about art, design and business.

    Please enable JavaScript in your browser to complete this form.
    Loading
    © 2025 MyForexView.
    • Home
    • Analysis
    • Economic Calendar

    Type above and press Enter to search. Press Esc to cancel.