Close Menu
My Forex View

    Subscribe to Updates

    Get the latest creative news from FooBar about art, design and business.

    Please enable JavaScript in your browser to complete this form.
    Loading
    What's Hot

    Technical Analysis – USDJPY tests 158.00 level for first time in five months

    December 27, 2024

    Daily Comment – Soft PCE inflation keeps rate cut hopes alive, but markets stay cautious

    December 23, 2024

    Technical Analysis – Gold returns above uptrend line

    December 23, 2024
    Facebook X (Twitter) Instagram
    • Live Market
    • Learn Forex Trading
    • Technical Analysis
    Facebook X (Twitter) Instagram Pinterest Vimeo
    My Forex ViewMy Forex View
    • Home
    • Live Market
      • GBPUSD
      • EURUSD
      • USDJPY
      • XAUUSD
      • All Currency Pair
      • All Commodities Pair
    • Analysis
    • Free Forex Signals
    • Education
    • Tools
      • Economic Calendar
      • Currency Converter
      • Risk of Ruin Calculator
      • Pivot Points Calculator
      • Crypto Exchange Fees Calculator
      • Fibonacci Calculator
      • Forex Rebates
      • Margin Calculator
      • Compounding Calculator
      • Profit Calculator
      • Pip Calculator
      • Lot Size Calculator
      • Drawdown Calculator
    • Blog
    Join Telegram
    My Forex View
    Home » Technical Analysis – GBPUSD shows signs of positive momentum
    GBPUSD

    Technical Analysis – GBPUSD shows signs of positive momentum

    Melina DeltasBy Melina DeltasDecember 5, 2024No Comments1 Min Read
    Facebook Twitter LinkedIn Pinterest Email
    • GBPUSD in bullish correction in short-term
    • RSI and MACD head north

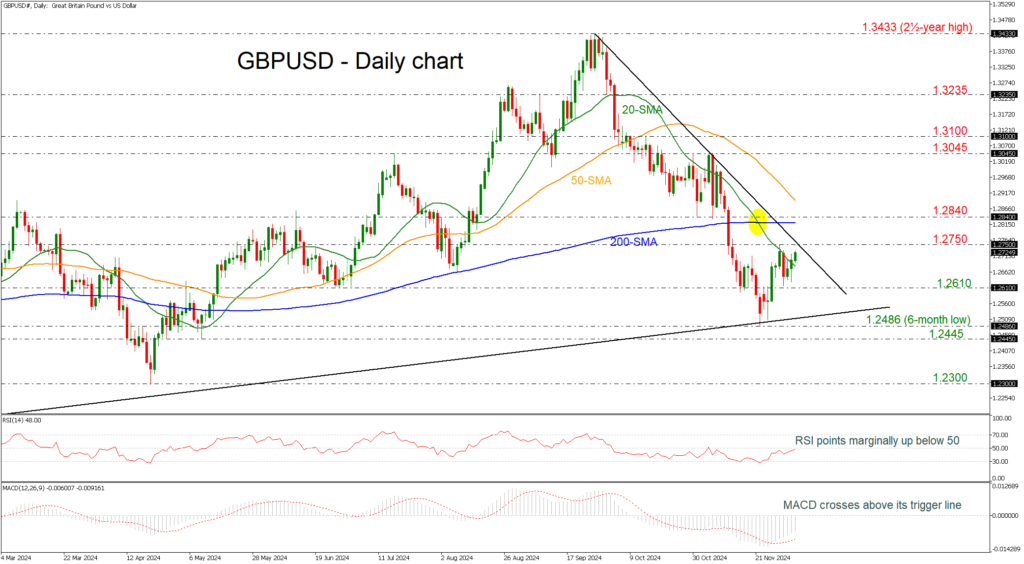
    GBPUSD has been in a rising correction mode over the last couple of weeks after the bounce off the six-month low of 1.2486. The pair may revisit the 1.2750 barrier, which is holding near the short-term downtrend line. If the market successfully breaks this area, it may face a significant challenge at the flat 200-day simple moving average (SMA) at 1.2820, before encountering the 1.2840 resistance and the 50-day SMA around 1.2900.

    However, if the price retreats below the 1.2610 support, then it may challenge the long-term ascending trend line at 1.2530 and the six-month bottom of 1.2486. Slightly lower, the 1.2445 support may pause the decline but the 1.2300 round number may be the next key turning point in the market.

    According to technical oscillators, the RSI is ready to cross above the 50 level, and the MACD is strengthening its positive momentum above its trigger line. Both are indicating further increases in the market.

    Overall, GBPUSD has shown a bullish tendency over the last one-and-a-half-year and any climbs beyond the 200-day SMA would also shift the short-term negative bias to a positive one.

    Share. Facebook Twitter Pinterest LinkedIn Telegram WhatsApp Copy Link
    Previous ArticleDaily Comment – Dollar recharges, Euro drops on French politics
    Next Article Daily Comment – Dollar awaits NFP, euro traders keep gaze locked on politics

    Related Posts

    GBPUSD

    Technical Analysis – GBPUSD is capped by 200-day SMA

    December 10, 2024
    GBPUSD

    Technical Analysis – GBPUSD gains traction near familiar support area

    November 19, 2024
    GBPUSD

    Technical Analysis – GBPUSD: One more burst of strength?

    October 23, 2024
    Top Posts

    Get a Free Xmaster Formula Indicator Forex for MT4

    July 30, 2024102 Views

    Technical Analysis – ETHUSD trades flat after ETF debut

    July 25, 202446 Views

    Traders Dynamic Index (TDI): Best Strategies and Settings

    August 16, 202441 Views
    Stay In Touch
    • Facebook
    • YouTube
    • TikTok
    • WhatsApp
    • Twitter
    • Instagram

    Subscribe to Updates

    Get the latest tech news from FooBar about tech, design and biz.

    Most Popular

    Get a Free Xmaster Formula Indicator Forex for MT4

    July 30, 2024102 Views

    Technical Analysis – ETHUSD trades flat after ETF debut

    July 25, 202446 Views

    Traders Dynamic Index (TDI): Best Strategies and Settings

    August 16, 202441 Views
    Our Picks

    Technical Analysis – USDJPY tests 158.00 level for first time in five months

    December 27, 2024

    Daily Comment – Soft PCE inflation keeps rate cut hopes alive, but markets stay cautious

    December 23, 2024

    Technical Analysis – Gold returns above uptrend line

    December 23, 2024

    Subscribe to Updates

    Get the latest creative news from FooBar about art, design and business.

    Please enable JavaScript in your browser to complete this form.
    Loading
    © 2025 MyForexView.
    • Home
    • Analysis
    • Economic Calendar

    Type above and press Enter to search. Press Esc to cancel.