Close Menu
My Forex View

    Subscribe to Updates

    Get the latest creative news from FooBar about art, design and business.

    Please enable JavaScript in your browser to complete this form.
    Loading
    What's Hot

    Technical Analysis – USDJPY tests 158.00 level for first time in five months

    December 27, 2024

    Daily Comment – Soft PCE inflation keeps rate cut hopes alive, but markets stay cautious

    December 23, 2024

    Technical Analysis – Gold returns above uptrend line

    December 23, 2024
    Facebook X (Twitter) Instagram
    • Live Market
    • Learn Forex Trading
    • Technical Analysis
    Facebook X (Twitter) Instagram Pinterest Vimeo
    My Forex ViewMy Forex View
    • Home
    • Live Market
      • GBPUSD
      • EURUSD
      • USDJPY
      • XAUUSD
      • All Currency Pair
      • All Commodities Pair
    • Analysis
    • Free Forex Signals
    • Education
    • Tools
      • Economic Calendar
      • Currency Converter
      • Risk of Ruin Calculator
      • Pivot Points Calculator
      • Crypto Exchange Fees Calculator
      • Fibonacci Calculator
      • Forex Rebates
      • Margin Calculator
      • Compounding Calculator
      • Profit Calculator
      • Pip Calculator
      • Lot Size Calculator
      • Drawdown Calculator
    • Blog
    Join Telegram
    My Forex View
    Home » Technical Analysis – GBPUSD slips near strong support of 1.3265
    GBPUSD

    Technical Analysis – GBPUSD slips near strong support of 1.3265

    Melina DeltasBy Melina DeltasOctober 2, 2024Updated:November 7, 2024No Comments1 Min Read
    Facebook Twitter LinkedIn Pinterest Email
    • GBPUSD remains above 20-day SMA
    • Stochastic and RSI reflect latest downside move.

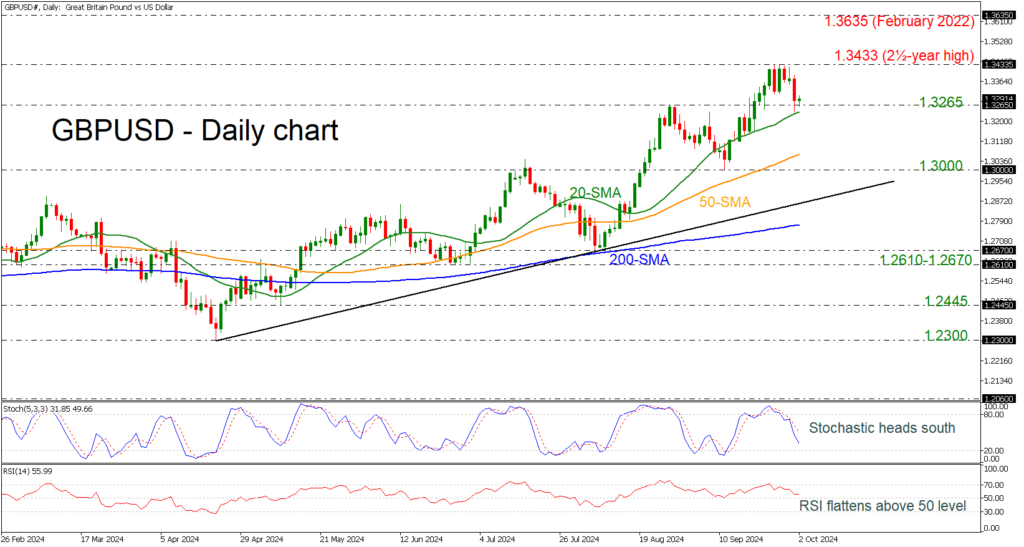
    GBPUSD is notably retreating from the two-and-a-half-year high of 1.3433, meeting the 20-day simple moving average (SMA) at 1.3235. Furthermore, the pair is still hovering above the strong support of 1.3265, but the technical oscillators mirror the latest downside move.

    The stochastic oscillator is heading south from the overbought region with strong momentum, while the RSI is moving horizontally above the neutral threshold of 50.

    As long as the price remains above 1.3265, it may challenge the 1.3433 resistance level before running towards the February 2022 high of 1.3635.

    Otherwise, a significant drop beneath the 20-day SMA may send the market towards the 50-day SMA at 1.3060, ahead of the 1.3000 key level. Steeper losses could pave the way for a test of the medium-term ascending trend line at 1.2910.

    All in all, GBPUSD has been in an upward trend since April, and only a decline beneath the 200-day SMA, which stands near 1.2770, may switch the outlook to bearish. 

    Source by: XM Global

    Share. Facebook Twitter Pinterest LinkedIn Telegram WhatsApp Copy Link
    Previous ArticleQuick Brief – Eurozone CPI drops below 2%, cementing October cut as euro slips
    Next Article Technical Analysis – USDJPY outlook remains gloomy

    Related Posts

    GBPUSD

    Technical Analysis – GBPUSD is capped by 200-day SMA

    December 10, 2024
    GBPUSD

    Technical Analysis – GBPUSD shows signs of positive momentum

    December 5, 2024
    GBPUSD

    Technical Analysis – GBPUSD gains traction near familiar support area

    November 19, 2024
    Top Posts

    Get a Free Xmaster Formula Indicator Forex for MT4

    July 30, 2024102 Views

    Technical Analysis – ETHUSD trades flat after ETF debut

    July 25, 202446 Views

    Traders Dynamic Index (TDI): Best Strategies and Settings

    August 16, 202435 Views
    Stay In Touch
    • Facebook
    • YouTube
    • TikTok
    • WhatsApp
    • Twitter
    • Instagram

    Subscribe to Updates

    Get the latest tech news from FooBar about tech, design and biz.

    Most Popular

    Get a Free Xmaster Formula Indicator Forex for MT4

    July 30, 2024102 Views

    Technical Analysis – ETHUSD trades flat after ETF debut

    July 25, 202446 Views

    Traders Dynamic Index (TDI): Best Strategies and Settings

    August 16, 202435 Views
    Our Picks

    Technical Analysis – USDJPY tests 158.00 level for first time in five months

    December 27, 2024

    Daily Comment – Soft PCE inflation keeps rate cut hopes alive, but markets stay cautious

    December 23, 2024

    Technical Analysis – Gold returns above uptrend line

    December 23, 2024

    Subscribe to Updates

    Get the latest creative news from FooBar about art, design and business.

    Please enable JavaScript in your browser to complete this form.
    Loading
    © 2025 MyForexView.
    • Home
    • Analysis
    • Economic Calendar

    Type above and press Enter to search. Press Esc to cancel.