Close Menu
My Forex View

    Subscribe to Updates

    Get the latest creative news from FooBar about art, design and business.

    Please enable JavaScript in your browser to complete this form.
    Loading
    What's Hot

    Technical Analysis – USDJPY tests 158.00 level for first time in five months

    December 27, 2024

    Daily Comment – Soft PCE inflation keeps rate cut hopes alive, but markets stay cautious

    December 23, 2024

    Technical Analysis – Gold returns above uptrend line

    December 23, 2024
    Facebook X (Twitter) Instagram
    • Live Market
    • Learn Forex Trading
    • Technical Analysis
    Facebook X (Twitter) Instagram Pinterest Vimeo
    My Forex ViewMy Forex View
    • Home
    • Live Market
      • GBPUSD
      • EURUSD
      • USDJPY
      • XAUUSD
      • All Currency Pair
      • All Commodities Pair
    • Analysis
    • Free Forex Signals
    • Education
    • Tools
      • Economic Calendar
      • Currency Converter
      • Risk of Ruin Calculator
      • Pivot Points Calculator
      • Crypto Exchange Fees Calculator
      • Fibonacci Calculator
      • Forex Rebates
      • Margin Calculator
      • Compounding Calculator
      • Profit Calculator
      • Pip Calculator
      • Lot Size Calculator
      • Drawdown Calculator
    • Blog
    Join Telegram
    My Forex View
    Home » Technical Analysis – Gold bulls take a rest after rallying
    Gold

    Technical Analysis – Gold bulls take a rest after rallying

    Christina ParthenidouBy Christina ParthenidouOctober 8, 2024Updated:November 7, 2024No Comments2 Mins Read
    Facebook Twitter LinkedIn Pinterest Email
    • Gold’s pace moderates within triangle prior to Thursday’s CPI inflation data
    • Technical signals favor the bears, but the trend may remain positive

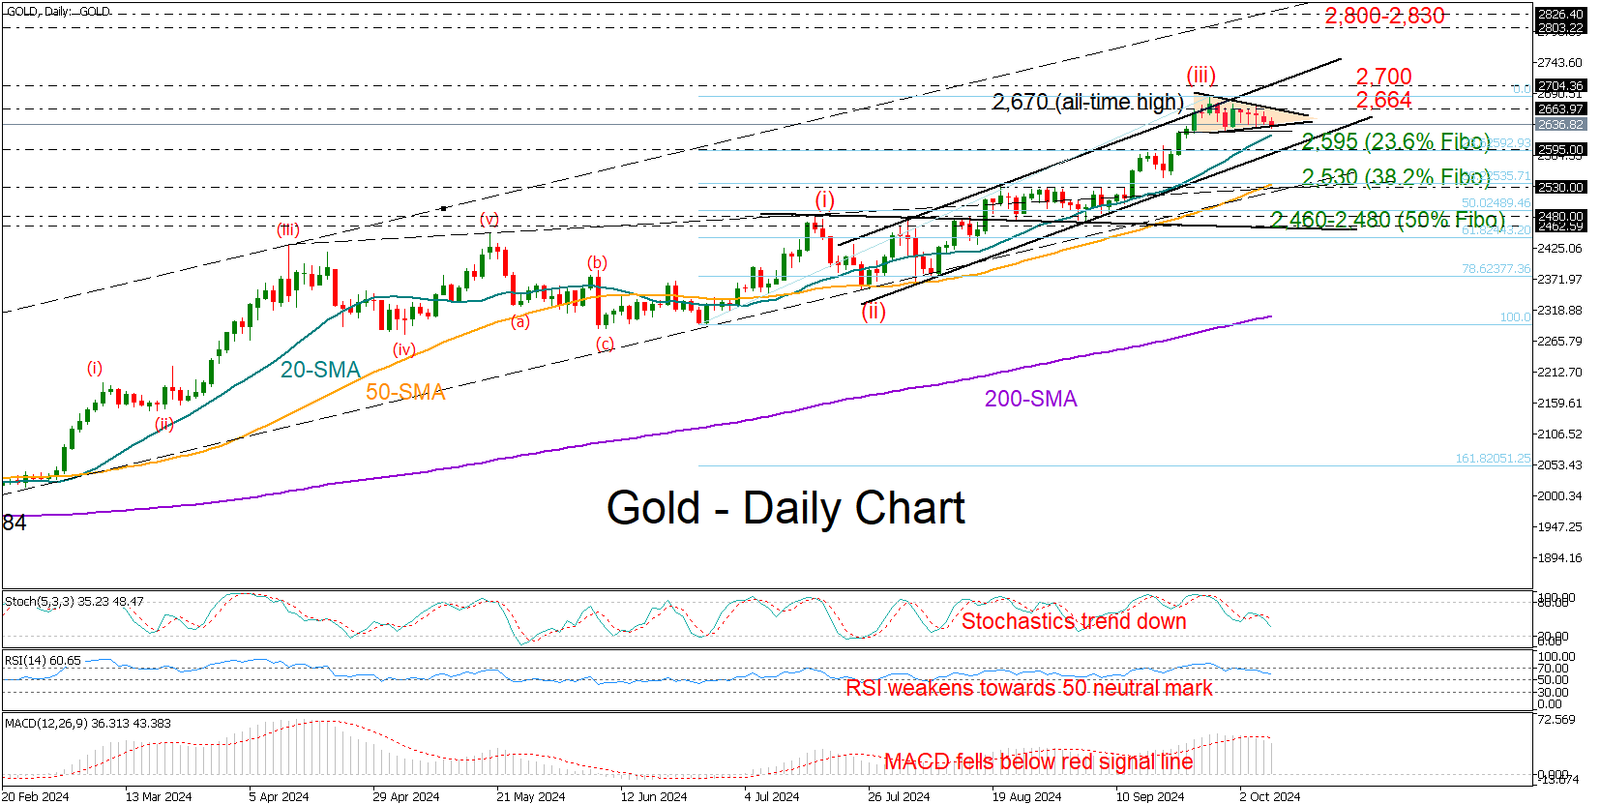
    Gold held within the range of 2,624-2,670 despite the upbeat US jobs data last Friday, forming a symmetrical neutral triangle at the top of its broad uptrend.

    Falling technical indicators suggest that buying sentiment is fading, leaving the precious metal vulnerable to downward movements in the upcoming sessions.

    That said, traders are unlikely to be concerned unless the price dives below the lower band of the three-month-old bullish channel near 2,595. This overlaps with the 23.6% Fibonacci retracement of the 1-3 Elliot wave upward pattern. Therefore, should sellers violate that base, the price could sink towards its 50-day SMA and the long-term support trendline from February at 2,528. Even lower, the door might open for the 50% Fibonacci mark of 2,480 and the almost flat restrictive line at 2,460, a break of which would shift the medium-term outlook back to neutral.

    Once the price surges above the triangle and the 2,664 level, the spotlight will immediately turn to the 2,700 psychological number and the channel’s resistance line. A successful penetration higher could last till the 2,800-2,830 region, where the ascending line that connects the highs from December 2023 and April 2024 is positioned.

    Summing up, gold is expected to take a breather following its latest peak at an all-time high of 2,670. Any downside movements could be part of the ongoing positive trend.

    Source by: XM Global

    Share. Facebook Twitter Pinterest LinkedIn Telegram WhatsApp Copy Link
    Previous ArticleTechnical Analysis – AUDJPY in the red again
    Next Article Daily Comment – Risk appetite ebbs as markets fret over China stimulus, Fed rate cuts

    Related Posts

    Technical Analysis

    Technical Analysis – USDJPY tests 158.00 level for first time in five months

    December 27, 2024
    Gold

    Technical Analysis – Gold returns above uptrend line

    December 23, 2024
    Technical Analysis

    Technical Analysis – USDCHF bulls are back and want to stay

    December 13, 2024
    Top Posts

    Get a Free Xmaster Formula Indicator Forex for MT4

    July 30, 2024102 Views

    Technical Analysis – ETHUSD trades flat after ETF debut

    July 25, 202446 Views

    Traders Dynamic Index (TDI): Best Strategies and Settings

    August 16, 202438 Views
    Stay In Touch
    • Facebook
    • YouTube
    • TikTok
    • WhatsApp
    • Twitter
    • Instagram

    Subscribe to Updates

    Get the latest tech news from FooBar about tech, design and biz.

    Most Popular

    Get a Free Xmaster Formula Indicator Forex for MT4

    July 30, 2024102 Views

    Technical Analysis – ETHUSD trades flat after ETF debut

    July 25, 202446 Views

    Traders Dynamic Index (TDI): Best Strategies and Settings

    August 16, 202438 Views
    Our Picks

    Technical Analysis – USDJPY tests 158.00 level for first time in five months

    December 27, 2024

    Daily Comment – Soft PCE inflation keeps rate cut hopes alive, but markets stay cautious

    December 23, 2024

    Technical Analysis – Gold returns above uptrend line

    December 23, 2024

    Subscribe to Updates

    Get the latest creative news from FooBar about art, design and business.

    Please enable JavaScript in your browser to complete this form.
    Loading
    © 2025 MyForexView.
    • Home
    • Analysis
    • Economic Calendar

    Type above and press Enter to search. Press Esc to cancel.