Close Menu
My Forex View

    Subscribe to Updates

    Get the latest creative news from FooBar about art, design and business.

    Please enable JavaScript in your browser to complete this form.
    Loading
    What's Hot

    Technical Analysis – USDJPY tests 158.00 level for first time in five months

    December 27, 2024

    Daily Comment – Soft PCE inflation keeps rate cut hopes alive, but markets stay cautious

    December 23, 2024

    Technical Analysis – Gold returns above uptrend line

    December 23, 2024
    Facebook X (Twitter) Instagram
    • Live Market
    • Learn Forex Trading
    • Technical Analysis
    Facebook X (Twitter) Instagram Pinterest Vimeo
    My Forex ViewMy Forex View
    • Home
    • Live Market
      • GBPUSD
      • EURUSD
      • USDJPY
      • XAUUSD
      • All Currency Pair
      • All Commodities Pair
    • Analysis
    • Free Forex Signals
    • Education
    • Tools
      • Economic Calendar
      • Currency Converter
      • Risk of Ruin Calculator
      • Pivot Points Calculator
      • Crypto Exchange Fees Calculator
      • Fibonacci Calculator
      • Forex Rebates
      • Margin Calculator
      • Compounding Calculator
      • Profit Calculator
      • Pip Calculator
      • Lot Size Calculator
      • Drawdown Calculator
    • Blog
    Join Telegram
    My Forex View
    Home » Technical Analysis – Gold near a peak, but uptrend might stay solid
    Gold

    Technical Analysis – Gold near a peak, but uptrend might stay solid

    Christina ParthenidouBy Christina ParthenidouSeptember 23, 2024Updated:November 7, 2024No Comments2 Mins Read
    Facebook Twitter LinkedIn Pinterest Email
    • Gold charts a new record high after a two-week rally
    • Technical picture signals a temporary slowdown

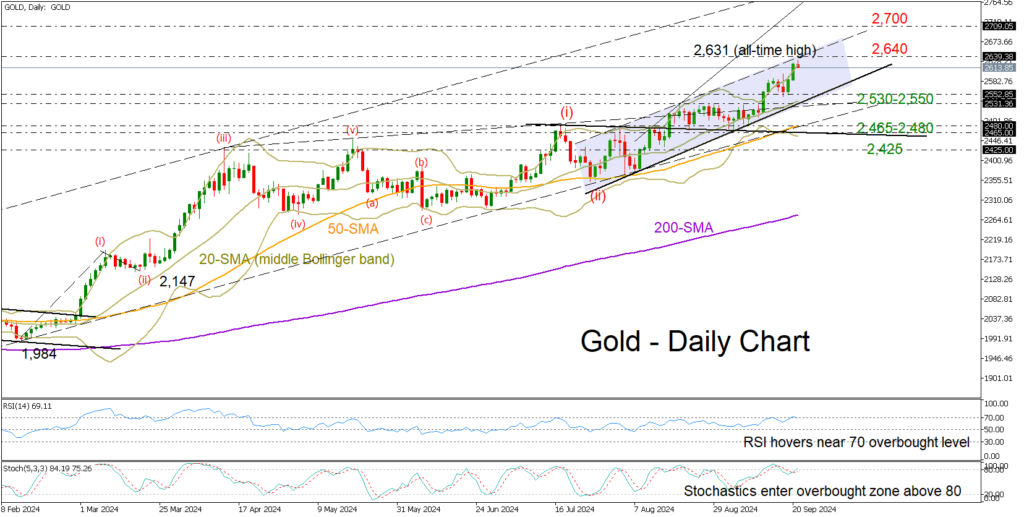
    Gold hit a new milestone early on Monday, unlocking a fresh record high of 2,631 following two consecutive impressive weeks in uncharted territory, which boosted the price by 5%.

    The precious metal is sailing in overbought waters according to the RSI and the stochastic oscillator, and with the price hanging around the upper Bollinger band and the upper band of an upward-sloping channel, the risk of a downside correction or some stability is increasing. An interesting observation emerging from counting Elliot waves (i-v) suggests that the market might be approaching the end of wave 3 in the bullish pattern, indicating a potential pause before wave 4 initiates.

    If the bulls stay trapped below the channel’s resistance line at 2,640, the spotlight will turn to the bottom of the channel and the 2,530-2,550 support region, which includes the 20-day simple moving average (SMA). A lower break could pause near the 50-day SMA and the almost flat constraining line which triggered September’s upturn at 2,480 and 2,465 respectively. Then, the bears could target the 2,425 region.

    On the upside, if the rally continues above 2,640, the next obstacle could pop up near the 2,700 psychological mark. Even higher, the price may retest the tentative ascending line which connects the December 2023 and April 2024 highs at 2,800.

    In a nutshell, the recent bullish trend in gold might lose momentum soon, but any drop in price could be temporary if it remains above 2,465.  

    Source by: XM Global

    Share. Facebook Twitter Pinterest LinkedIn Telegram WhatsApp Copy Link
    Previous ArticleMastering the Risk Reward Indicator for MT4: A Trader Guide
    Next Article Weekly Technical Outlook – USDCHF, AUDUSD, EURUSD

    Related Posts

    Technical Analysis

    Technical Analysis – USDJPY tests 158.00 level for first time in five months

    December 27, 2024
    Gold

    Technical Analysis – Gold returns above uptrend line

    December 23, 2024
    Technical Analysis

    Technical Analysis – USDCHF bulls are back and want to stay

    December 13, 2024
    Top Posts

    Get a Free Xmaster Formula Indicator Forex for MT4

    July 30, 2024102 Views

    Technical Analysis – ETHUSD trades flat after ETF debut

    July 25, 202446 Views

    Traders Dynamic Index (TDI): Best Strategies and Settings

    August 16, 202438 Views
    Stay In Touch
    • Facebook
    • YouTube
    • TikTok
    • WhatsApp
    • Twitter
    • Instagram

    Subscribe to Updates

    Get the latest tech news from FooBar about tech, design and biz.

    Most Popular

    Get a Free Xmaster Formula Indicator Forex for MT4

    July 30, 2024102 Views

    Technical Analysis – ETHUSD trades flat after ETF debut

    July 25, 202446 Views

    Traders Dynamic Index (TDI): Best Strategies and Settings

    August 16, 202438 Views
    Our Picks

    Technical Analysis – USDJPY tests 158.00 level for first time in five months

    December 27, 2024

    Daily Comment – Soft PCE inflation keeps rate cut hopes alive, but markets stay cautious

    December 23, 2024

    Technical Analysis – Gold returns above uptrend line

    December 23, 2024

    Subscribe to Updates

    Get the latest creative news from FooBar about art, design and business.

    Please enable JavaScript in your browser to complete this form.
    Loading
    © 2025 MyForexView.
    • Home
    • Analysis
    • Economic Calendar

    Type above and press Enter to search. Press Esc to cancel.