Close Menu
My Forex View

    Subscribe to Updates

    Get the latest creative news from FooBar about art, design and business.

    Please enable JavaScript in your browser to complete this form.
    Loading
    What's Hot

    Technical Analysis – USDJPY tests 158.00 level for first time in five months

    December 27, 2024

    Daily Comment – Soft PCE inflation keeps rate cut hopes alive, but markets stay cautious

    December 23, 2024

    Technical Analysis – Gold returns above uptrend line

    December 23, 2024
    Facebook X (Twitter) Instagram
    • Live Market
    • Learn Forex Trading
    • Technical Analysis
    Facebook X (Twitter) Instagram Pinterest Vimeo
    My Forex ViewMy Forex View
    • Home
    • Live Market
      • GBPUSD
      • EURUSD
      • USDJPY
      • XAUUSD
      • All Currency Pair
      • All Commodities Pair
    • Analysis
    • Free Forex Signals
    • Education
    • Tools
      • Economic Calendar
      • Currency Converter
      • Risk of Ruin Calculator
      • Pivot Points Calculator
      • Crypto Exchange Fees Calculator
      • Fibonacci Calculator
      • Forex Rebates
      • Margin Calculator
      • Compounding Calculator
      • Profit Calculator
      • Pip Calculator
      • Lot Size Calculator
      • Drawdown Calculator
    • Blog
    Join Telegram
    My Forex View
    Home » Technical Analysis – Gold rally in question
    Gold

    Technical Analysis – Gold rally in question

    Achilleas GeorgolopoulosBy Achilleas GeorgolopoulosAugust 5, 2024Updated:November 7, 2024No Comments2 Mins Read
    Facebook Twitter LinkedIn Pinterest Email
    • Gold is lower today, but close to recent highs
    • Geopolitics and dollar underperformance support gold
    • Momentum indicators are tentatively bullish

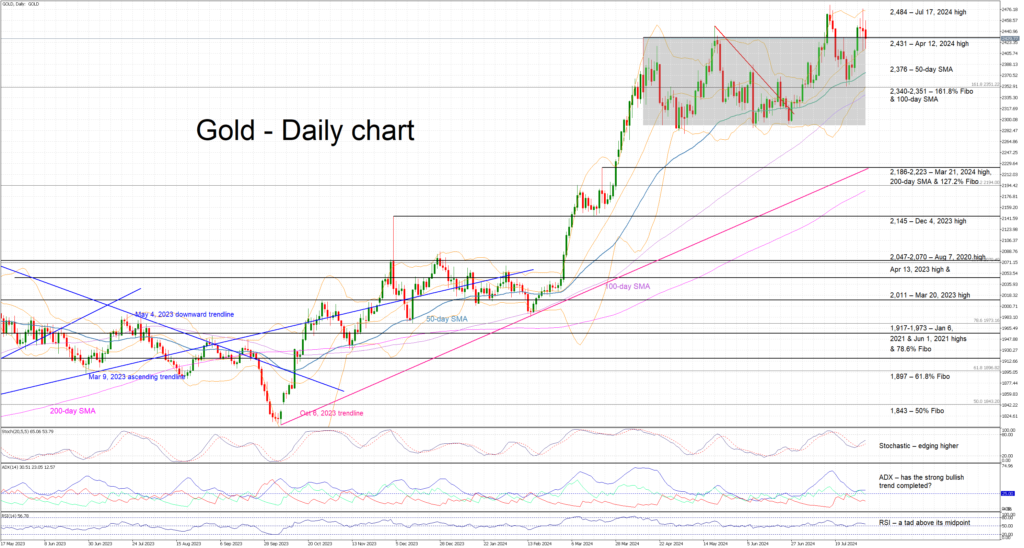
    Gold is trading lower again today, recording its third consecutive red candle, but remaining a tad below its recent all-time high. It is currently testing the upper boundary of the rectangle that has been defining market action since early April. Developments in the Middle East, the increased chances of an aggressive easing by the Fed, and the pressure on the stock markets are possibly limiting the bears’ ability to stage a strong correction.

    In the meantime, the momentum indicators are tentatively bullish. The RSI remains above its midpoint but shows little appetite for a move higher. Similarly, the Average Directional Movement Index (ADX) is hovering a tad above its 25 midpoint and thus pointing to a muted bullish trend in gold. More importantly, the stochastic oscillator has crossed above its moving average (MA) and it is currently moving towards its overbought territory.

    Should the bulls remain hungry, they could try to keep gold above the recent rectangle and April 12, 2024, high at 2,431, and then gradually stage a move, which might not be as straightforward as it sounds, towards the all-time high of 2,484.

    On the flip side, the bears are keen for the current correction to pick up speed. They could try to push gold below the 2,431 level and then have a go at overcoming the support set by the 50-day simple moving average (SMA) at 2,376. If successful, they could then lead gold towards the busier 2,340-2,351 range, which is populated by the 100-day SMA and the 161.8% Fibonacci extension of March 8, 2022 – September 28, 2022 downtrend.

    To sum up, gold is in the red today, and increasing risk appetite is most likely needed for gold bears to retake market control.

    Source by: XM Global

    Share. Facebook Twitter Pinterest LinkedIn Telegram WhatsApp Copy Link
    Previous ArticleMost 10 Economic Calendar Events Every Trader Should Watch
    Next Article Weekly Technical Outlook– USDJPY, USDCAD, AUDUSD

    Related Posts

    Technical Analysis

    Technical Analysis – USDJPY tests 158.00 level for first time in five months

    December 27, 2024
    Gold

    Technical Analysis – Gold returns above uptrend line

    December 23, 2024
    Technical Analysis

    Technical Analysis – USDCHF bulls are back and want to stay

    December 13, 2024
    Top Posts

    Get a Free Xmaster Formula Indicator Forex for MT4

    July 30, 2024102 Views

    Technical Analysis – ETHUSD trades flat after ETF debut

    July 25, 202446 Views

    Traders Dynamic Index (TDI): Best Strategies and Settings

    August 16, 202435 Views
    Stay In Touch
    • Facebook
    • YouTube
    • TikTok
    • WhatsApp
    • Twitter
    • Instagram

    Subscribe to Updates

    Get the latest tech news from FooBar about tech, design and biz.

    Most Popular

    Get a Free Xmaster Formula Indicator Forex for MT4

    July 30, 2024102 Views

    Technical Analysis – ETHUSD trades flat after ETF debut

    July 25, 202446 Views

    Traders Dynamic Index (TDI): Best Strategies and Settings

    August 16, 202435 Views
    Our Picks

    Technical Analysis – USDJPY tests 158.00 level for first time in five months

    December 27, 2024

    Daily Comment – Soft PCE inflation keeps rate cut hopes alive, but markets stay cautious

    December 23, 2024

    Technical Analysis – Gold returns above uptrend line

    December 23, 2024

    Subscribe to Updates

    Get the latest creative news from FooBar about art, design and business.

    Please enable JavaScript in your browser to complete this form.
    Loading
    © 2025 MyForexView.
    • Home
    • Analysis
    • Economic Calendar

    Type above and press Enter to search. Press Esc to cancel.