Close Menu
My Forex View

    Subscribe to Updates

    Get the latest creative news from FooBar about art, design and business.

    Please enable JavaScript in your browser to complete this form.
    Loading
    What's Hot

    Technical Analysis – USDJPY tests 158.00 level for first time in five months

    December 27, 2024

    Daily Comment – Soft PCE inflation keeps rate cut hopes alive, but markets stay cautious

    December 23, 2024

    Technical Analysis – Gold returns above uptrend line

    December 23, 2024
    Facebook X (Twitter) Instagram
    • Live Market
    • Learn Forex Trading
    • Technical Analysis
    Facebook X (Twitter) Instagram Pinterest Vimeo
    My Forex ViewMy Forex View
    • Home
    • Live Market
      • GBPUSD
      • EURUSD
      • USDJPY
      • XAUUSD
      • All Currency Pair
      • All Commodities Pair
    • Analysis
    • Free Forex Signals
    • Education
    • Tools
      • Economic Calendar
      • Currency Converter
      • Risk of Ruin Calculator
      • Pivot Points Calculator
      • Crypto Exchange Fees Calculator
      • Fibonacci Calculator
      • Forex Rebates
      • Margin Calculator
      • Compounding Calculator
      • Profit Calculator
      • Pip Calculator
      • Lot Size Calculator
      • Drawdown Calculator
    • Blog
    Join Telegram
    My Forex View
    Home » Technical Analysis – Gold seeks new buyers to trim rapid downfall
    Gold

    Technical Analysis – Gold seeks new buyers to trim rapid downfall

    Christina ParthenidouBy Christina ParthenidouJuly 24, 2024Updated:November 7, 2024No Comments2 Mins Read
    Facebook Twitter LinkedIn Pinterest Email
    • Gold turns up again after a brutal downfall
    • Short-term risk is positive, but caution is required near 2,430-2,438
    • US S&P Global PMIs could generate fresh volatility at 13:45 GMT

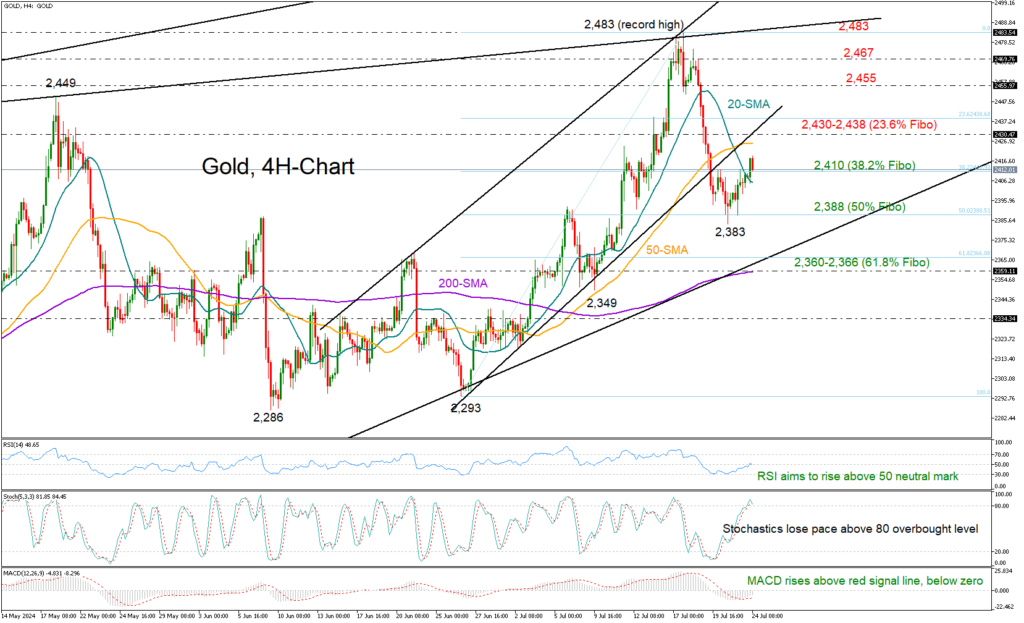
    Gold found fresh buying interest after its aggressive pullback from a record high of 2,483 paused at 2,383. The precious metal is currently looking to gain more ground following its close above the 20-period simple moving average (SMA) and the 38.2% Fibonacci retracement of the latest upleg at 2,410.

    From a technical perspective, the risk is skewed to the upside as the RSI is set to cross above its 50 neutral mark and the MACD, although negative, is showing some recovery above its red signal line. Nevertheless, with the stochastic oscillator nearing its previous highs in the overbought region, any potential rises may be gradual.

    The 50-period SMA and the broken ascending trendline drawn from June’s low at 2,430 will be hard to miss before the 23.6% Fibonacci mark of 2,438 comes into view. If the bulls breach the latter, they might initially head for May’s peak of 2,449 and then for the 2,467 barrier. Further up, the price could push for new higher highs above the all-time high of 2,483.

    Should the bears press the price below the 38.2% Fibonacci of 2,410 and the 20-period SMA, support could immediately come from the 50% Fibonacci of 2,388, where the price bottomed out earlier this week. Additional declines from there could face a tougher hurdle near the 200-period SMA and the ascending trendline from the February low, currently seen near the 61.8% Fibonacci of 2,366.

    In short, gold’s ongoing upturn could gather more strength, though buyers are expected to show greater interest once the price surpasses the barrier at 2,430-2,438.

    Source by: XM Global

    Share. Facebook Twitter Pinterest LinkedIn Telegram WhatsApp Copy Link
    Next Article Technical Analysis – USDJPY edges lower near 2-month low

    Related Posts

    Technical Analysis

    Technical Analysis – USDJPY tests 158.00 level for first time in five months

    December 27, 2024
    Gold

    Technical Analysis – Gold returns above uptrend line

    December 23, 2024
    Technical Analysis

    Technical Analysis – USDCHF bulls are back and want to stay

    December 13, 2024
    Top Posts

    Get a Free Xmaster Formula Indicator Forex for MT4

    July 30, 2024102 Views

    Technical Analysis – ETHUSD trades flat after ETF debut

    July 25, 202446 Views

    Traders Dynamic Index (TDI): Best Strategies and Settings

    August 16, 202438 Views
    Stay In Touch
    • Facebook
    • YouTube
    • TikTok
    • WhatsApp
    • Twitter
    • Instagram

    Subscribe to Updates

    Get the latest tech news from FooBar about tech, design and biz.

    Most Popular

    Get a Free Xmaster Formula Indicator Forex for MT4

    July 30, 2024102 Views

    Technical Analysis – ETHUSD trades flat after ETF debut

    July 25, 202446 Views

    Traders Dynamic Index (TDI): Best Strategies and Settings

    August 16, 202438 Views
    Our Picks

    Technical Analysis – USDJPY tests 158.00 level for first time in five months

    December 27, 2024

    Daily Comment – Soft PCE inflation keeps rate cut hopes alive, but markets stay cautious

    December 23, 2024

    Technical Analysis – Gold returns above uptrend line

    December 23, 2024

    Subscribe to Updates

    Get the latest creative news from FooBar about art, design and business.

    Please enable JavaScript in your browser to complete this form.
    Loading
    © 2025 MyForexView.
    • Home
    • Analysis
    • Economic Calendar

    Type above and press Enter to search. Press Esc to cancel.