Close Menu
My Forex View

    Subscribe to Updates

    Get the latest creative news from FooBar about art, design and business.

    Please enable JavaScript in your browser to complete this form.
    Loading
    What's Hot

    Technical Analysis – USDJPY tests 158.00 level for first time in five months

    December 27, 2024

    Daily Comment – Soft PCE inflation keeps rate cut hopes alive, but markets stay cautious

    December 23, 2024

    Technical Analysis – Gold returns above uptrend line

    December 23, 2024
    Facebook X (Twitter) Instagram
    • Live Market
    • Learn Forex Trading
    • Technical Analysis
    Facebook X (Twitter) Instagram Pinterest Vimeo
    My Forex ViewMy Forex View
    • Home
    • Live Market
      • GBPUSD
      • EURUSD
      • USDJPY
      • XAUUSD
      • All Currency Pair
      • All Commodities Pair
    • Analysis
    • Free Forex Signals
    • Education
    • Tools
      • Economic Calendar
      • Currency Converter
      • Risk of Ruin Calculator
      • Pivot Points Calculator
      • Crypto Exchange Fees Calculator
      • Fibonacci Calculator
      • Forex Rebates
      • Margin Calculator
      • Compounding Calculator
      • Profit Calculator
      • Pip Calculator
      • Lot Size Calculator
      • Drawdown Calculator
    • Blog
    Join Telegram
    My Forex View
    Home » Technical Analysis – Gold shifts attention to uncharted territory
    Gold

    Technical Analysis – Gold shifts attention to uncharted territory

    Christina ParthenidouBy Christina ParthenidouSeptember 11, 2024Updated:November 7, 2024No Comments2 Mins Read
    Facebook Twitter LinkedIn Pinterest Email
    • Gold looks for a bullish breakout above rectangle
    • Bullish sentiment dominates; stability cannot be ruled out
    • US CPI inflation figures due for release at 12:30 GMT

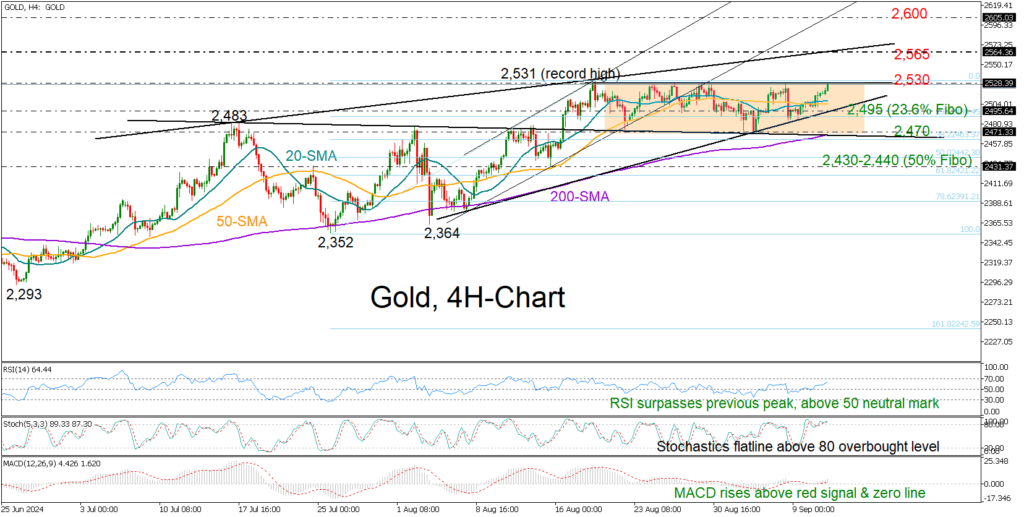
    Gold rapidly approached the upper band of its three-week-old tight range at 2,530, increasing the possibility of entering unexplored territory.

    The ball is still in the bulls’ court according to the technical indicators in the four-hour chart. The RSI is making a new higher high above its 50 neutral mark and the MACD is progressing within the positive area, though it’s near its previous peak, and the stochastic oscillator is fluctuating within the overbought region, keeping some scepticism in place.

    Should the long-term uptrend resume above 2,530, the precious metal could ascend towards the resistance line at 2,565. Then, a decisive move higher could face a psychological test near the 2,600 level, a break of which could bring the 2,650 zone next into view.

    In the event of a downside reversal, the 2,495 region, which encapsulates the 23.6% Fibonacci retracement of the July-August upleg, could act as support, preventing a drop towards the 200-day SMA and the lower band of the rectangle pattern at 2,470. The 38.2% Fibonacci mark is within this neighborhood. Therefore, a clear violation of this base might upset traders, forcing a rapid correction towards the 50% Fibonacci of 2,440 and the August 15 low of 2,332.

    Overall, gold is trying once again to break free from its short-term horizontal path and reach new record highs, with the technical signals backing the current bullish attempt. 

    Source by: XM Global

    Share. Facebook Twitter Pinterest LinkedIn Telegram WhatsApp Copy Link
    Previous ArticleTechnical Analysis – USDJPY plummets to new 9-month low
    Next Article Daily Comment – Equities are directionless ahead of US inflation report

    Related Posts

    Technical Analysis

    Technical Analysis – USDJPY tests 158.00 level for first time in five months

    December 27, 2024
    Gold

    Technical Analysis – Gold returns above uptrend line

    December 23, 2024
    Technical Analysis

    Technical Analysis – USDCHF bulls are back and want to stay

    December 13, 2024
    Top Posts

    Get a Free Xmaster Formula Indicator Forex for MT4

    July 30, 2024102 Views

    Technical Analysis – ETHUSD trades flat after ETF debut

    July 25, 202446 Views

    Traders Dynamic Index (TDI): Best Strategies and Settings

    August 16, 202438 Views
    Stay In Touch
    • Facebook
    • YouTube
    • TikTok
    • WhatsApp
    • Twitter
    • Instagram

    Subscribe to Updates

    Get the latest tech news from FooBar about tech, design and biz.

    Most Popular

    Get a Free Xmaster Formula Indicator Forex for MT4

    July 30, 2024102 Views

    Technical Analysis – ETHUSD trades flat after ETF debut

    July 25, 202446 Views

    Traders Dynamic Index (TDI): Best Strategies and Settings

    August 16, 202438 Views
    Our Picks

    Technical Analysis – USDJPY tests 158.00 level for first time in five months

    December 27, 2024

    Daily Comment – Soft PCE inflation keeps rate cut hopes alive, but markets stay cautious

    December 23, 2024

    Technical Analysis – Gold returns above uptrend line

    December 23, 2024

    Subscribe to Updates

    Get the latest creative news from FooBar about art, design and business.

    Please enable JavaScript in your browser to complete this form.
    Loading
    © 2025 MyForexView.
    • Home
    • Analysis
    • Economic Calendar

    Type above and press Enter to search. Press Esc to cancel.