Close Menu
My Forex View

    Subscribe to Updates

    Get the latest creative news from FooBar about art, design and business.

    Please enable JavaScript in your browser to complete this form.
    Loading
    What's Hot

    Technical Analysis – USDJPY tests 158.00 level for first time in five months

    December 27, 2024

    Daily Comment – Soft PCE inflation keeps rate cut hopes alive, but markets stay cautious

    December 23, 2024

    Technical Analysis – Gold returns above uptrend line

    December 23, 2024
    Facebook X (Twitter) Instagram
    • Live Market
    • Learn Forex Trading
    • Technical Analysis
    Facebook X (Twitter) Instagram Pinterest Vimeo
    My Forex ViewMy Forex View
    • Home
    • Live Market
      • GBPUSD
      • EURUSD
      • USDJPY
      • XAUUSD
      • All Currency Pair
      • All Commodities Pair
    • Analysis
    • Free Forex Signals
    • Education
    • Tools
      • Economic Calendar
      • Currency Converter
      • Risk of Ruin Calculator
      • Pivot Points Calculator
      • Crypto Exchange Fees Calculator
      • Fibonacci Calculator
      • Forex Rebates
      • Margin Calculator
      • Compounding Calculator
      • Profit Calculator
      • Pip Calculator
      • Lot Size Calculator
      • Drawdown Calculator
    • Blog
    Join Telegram
    My Forex View
    Home » Technical Analysis – Gold weakness might have legs
    Gold

    Technical Analysis – Gold weakness might have legs

    Achilleas GeorgolopoulosBy Achilleas GeorgolopoulosSeptember 9, 2024Updated:November 7, 2024No Comments2 Mins Read
    Facebook Twitter LinkedIn Pinterest Email
    • Gold is trading lower today, but close to recent highs
    • It failed to benefit from Friday’s negative stock market reaction
    • Momentum indicators remain mixed

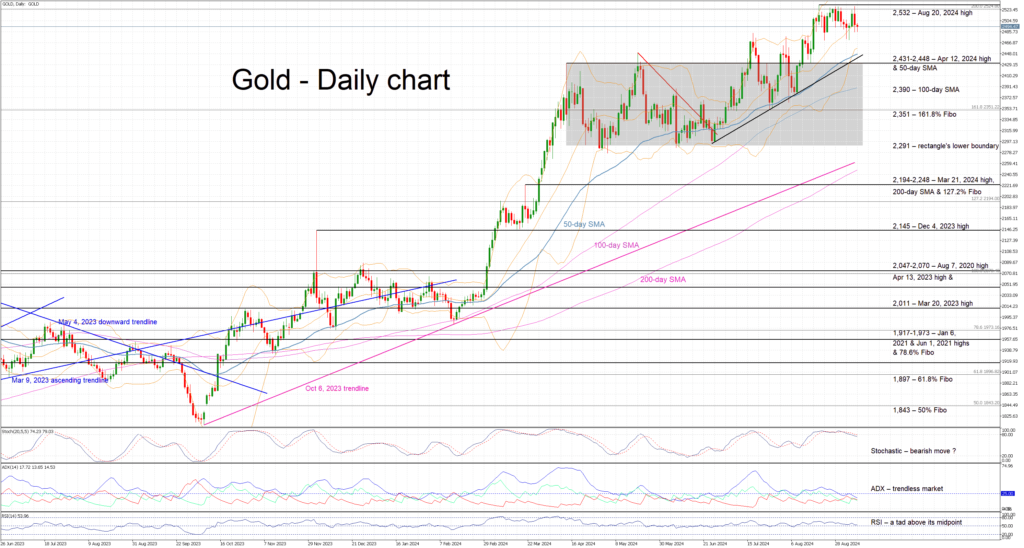
    Gold is trading lower again today, recording its second consecutive red candle, but remaining a tad below its recent all-time high of $2,532. Last Friday’s non-farm payrolls figure resulted in an acute market reaction with the S&P 500 index recording its worst weekly performance since 2023, but gold failed to benefit. Similarly, developments in both the Middle East and the Ukraine-Russia conflict continue to have little impact on gold prices.

    In the meantime, the momentum indicators remain mixed. The RSI remains above its midpoint but shows little appetite for a move higher. Similarly, the Average Directional Movement Index (ADX) is hovering well below its 25 midpoint, thus revealing a trendless gold market. More importantly, the stochastic oscillator has crossed below both its moving average (MA) and overbought territory, and it is currently tentatively edging lower. Should this move pick up pace, it could be seen as a strong bearish signal.

    If the bulls remain confident, they could try to regain the market reins and gradually overcome the all-time high at 2,532. If successful, they would enter uncharted waters again, with the next plausible target being the 2,600 level, which coincided with the 261.8% Fibonacci extension of the March 8, 2022 – September 28, 2022 downtrend.

    On the flip side, the bears are keen for the current correction to accelerate. They could push gold towards the 2,431-2,448 area, which is defined by the April 12, 2024, high and the 50-day simple moving average (SMA). Even lower, the 100-day SMA and the 161.8% Fibonacci extension at 2,390 and 2,351 respectively, a tad above the lower boundary of the developing rectangle at 2,291, could really trouble the bears.

    To sum up, gold is in the red again today despite the decreasing risk appetite as the market is digesting last week’s US data releases and preparing for another action-packed week. 

    Source by: XM Global

    Share. Facebook Twitter Pinterest LinkedIn Telegram WhatsApp Copy Link
    Previous ArticleBull vs Bear Pattern: Master Key Signals for Profitable Trades
    Next Article Weekly Technical Outlook – EURUSD, USDJPY, GBPUSD

    Related Posts

    Technical Analysis

    Technical Analysis – USDJPY tests 158.00 level for first time in five months

    December 27, 2024
    Gold

    Technical Analysis – Gold returns above uptrend line

    December 23, 2024
    Technical Analysis

    Technical Analysis – USDCHF bulls are back and want to stay

    December 13, 2024
    Top Posts

    Get a Free Xmaster Formula Indicator Forex for MT4

    July 30, 2024102 Views

    Technical Analysis – ETHUSD trades flat after ETF debut

    July 25, 202446 Views

    Traders Dynamic Index (TDI): Best Strategies and Settings

    August 16, 202438 Views
    Stay In Touch
    • Facebook
    • YouTube
    • TikTok
    • WhatsApp
    • Twitter
    • Instagram

    Subscribe to Updates

    Get the latest tech news from FooBar about tech, design and biz.

    Most Popular

    Get a Free Xmaster Formula Indicator Forex for MT4

    July 30, 2024102 Views

    Technical Analysis – ETHUSD trades flat after ETF debut

    July 25, 202446 Views

    Traders Dynamic Index (TDI): Best Strategies and Settings

    August 16, 202438 Views
    Our Picks

    Technical Analysis – USDJPY tests 158.00 level for first time in five months

    December 27, 2024

    Daily Comment – Soft PCE inflation keeps rate cut hopes alive, but markets stay cautious

    December 23, 2024

    Technical Analysis – Gold returns above uptrend line

    December 23, 2024

    Subscribe to Updates

    Get the latest creative news from FooBar about art, design and business.

    Please enable JavaScript in your browser to complete this form.
    Loading
    © 2025 MyForexView.
    • Home
    • Analysis
    • Economic Calendar

    Type above and press Enter to search. Press Esc to cancel.