Close Menu
My Forex View

    Subscribe to Updates

    Get the latest creative news from FooBar about art, design and business.

    Please enable JavaScript in your browser to complete this form.
    Loading
    What's Hot

    Technical Analysis – USDJPY tests 158.00 level for first time in five months

    December 27, 2024

    Daily Comment – Soft PCE inflation keeps rate cut hopes alive, but markets stay cautious

    December 23, 2024

    Technical Analysis – Gold returns above uptrend line

    December 23, 2024
    Facebook X (Twitter) Instagram
    • Live Market
    • Learn Forex Trading
    • Technical Analysis
    Facebook X (Twitter) Instagram Pinterest Vimeo
    My Forex ViewMy Forex View
    • Home
    • Live Market
      • GBPUSD
      • EURUSD
      • USDJPY
      • XAUUSD
      • All Currency Pair
      • All Commodities Pair
    • Analysis
    • Free Forex Signals
    • Education
    • Tools
      • Economic Calendar
      • Currency Converter
      • Risk of Ruin Calculator
      • Pivot Points Calculator
      • Crypto Exchange Fees Calculator
      • Fibonacci Calculator
      • Forex Rebates
      • Margin Calculator
      • Compounding Calculator
      • Profit Calculator
      • Pip Calculator
      • Lot Size Calculator
      • Drawdown Calculator
    • Blog
    Join Telegram
    My Forex View
    Home » Technical Analysis – NZDUSD battles with 200-day SMA after RBNZ’s rate cut
    NZDUSD

    Technical Analysis – NZDUSD battles with 200-day SMA after RBNZ’s rate cut

    Melina DeltasBy Melina DeltasOctober 9, 2024Updated:November 7, 2024No Comments2 Mins Read
    Facebook Twitter LinkedIn Pinterest Email
    • NZDUSD continues the bearish correction
    • Technical oscillators are mixed

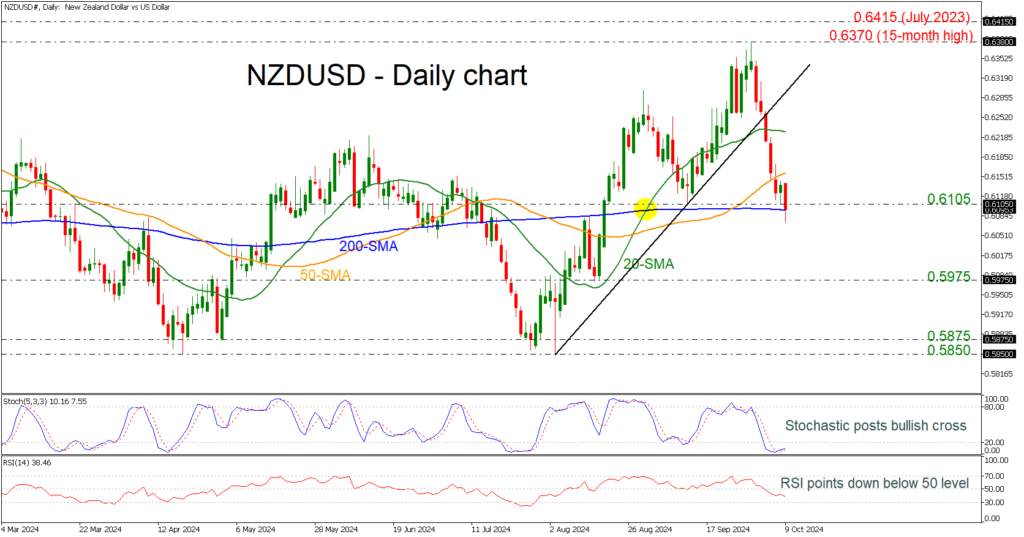
    NZDUSD plunged significantly after the RBNZ’s decision to cut interest rates by 50 bps. The pair remained closed to the 0.6100 round number and is holding near the 200-day simple moving average (SMA), which is acting as a strong support level.

    The technical oscillators are showing some contradicting signals. The stochastic oscillator is pointing upwards in the oversold area after a bullish cross within its %K and %D lines; however, the RSI is pointing down below the neutral threshold of 50.

    If the market retreats further, the next support to pause the bearish action is coming from the previous troughs on August 15 at 0.5975. Moving lower, the support area of 0.5850-0.5875 may halt the steep negative momentum.

    On the other hand, a potential rebound off the 0.6105 barrier may send the pair up to the 50-day SMA at 0.6160 and the 20-day SMA at 0.6225. More increases may take the bulls back towards the 15-month peak of 0.6370 and slightly higher to 0.6415, registered in July 2023, adding some optimism for upside pressure.

    To sum up, as long as the market remains above the 200-day SMA, the bias remains positive despite the aggressive selling interest in the last few days.

    Source by: XM Global

    Share. Facebook Twitter Pinterest LinkedIn Telegram WhatsApp Copy Link
    Previous ArticleDaily Comment – Risk appetite ebbs as markets fret over China stimulus, Fed rate cuts
    Next Article Technical Analysis – USDJPY hovers near 38.2% Fibonacci level

    Related Posts

    Technical Analysis

    Technical Analysis – USDJPY tests 158.00 level for first time in five months

    December 27, 2024
    Gold

    Technical Analysis – Gold returns above uptrend line

    December 23, 2024
    Technical Analysis

    Technical Analysis – USDCHF bulls are back and want to stay

    December 13, 2024
    Top Posts

    Get a Free Xmaster Formula Indicator Forex for MT4

    July 30, 2024102 Views

    Technical Analysis – ETHUSD trades flat after ETF debut

    July 25, 202446 Views

    Traders Dynamic Index (TDI): Best Strategies and Settings

    August 16, 202438 Views
    Stay In Touch
    • Facebook
    • YouTube
    • TikTok
    • WhatsApp
    • Twitter
    • Instagram

    Subscribe to Updates

    Get the latest tech news from FooBar about tech, design and biz.

    Most Popular

    Get a Free Xmaster Formula Indicator Forex for MT4

    July 30, 2024102 Views

    Technical Analysis – ETHUSD trades flat after ETF debut

    July 25, 202446 Views

    Traders Dynamic Index (TDI): Best Strategies and Settings

    August 16, 202438 Views
    Our Picks

    Technical Analysis – USDJPY tests 158.00 level for first time in five months

    December 27, 2024

    Daily Comment – Soft PCE inflation keeps rate cut hopes alive, but markets stay cautious

    December 23, 2024

    Technical Analysis – Gold returns above uptrend line

    December 23, 2024

    Subscribe to Updates

    Get the latest creative news from FooBar about art, design and business.

    Please enable JavaScript in your browser to complete this form.
    Loading
    © 2025 MyForexView.
    • Home
    • Analysis
    • Economic Calendar

    Type above and press Enter to search. Press Esc to cancel.