Close Menu
My Forex View

    Subscribe to Updates

    Get the latest creative news from FooBar about art, design and business.

    Please enable JavaScript in your browser to complete this form.
    Loading
    What's Hot

    Technical Analysis – USDJPY tests 158.00 level for first time in five months

    December 27, 2024

    Daily Comment – Soft PCE inflation keeps rate cut hopes alive, but markets stay cautious

    December 23, 2024

    Technical Analysis – Gold returns above uptrend line

    December 23, 2024
    Facebook X (Twitter) Instagram
    • Live Market
    • Learn Forex Trading
    • Technical Analysis
    Facebook X (Twitter) Instagram Pinterest Vimeo
    My Forex ViewMy Forex View
    • Home
    • Live Market
      • GBPUSD
      • EURUSD
      • USDJPY
      • XAUUSD
      • All Currency Pair
      • All Commodities Pair
    • Analysis
    • Free Forex Signals
    • Education
    • Tools
      • Economic Calendar
      • Currency Converter
      • Risk of Ruin Calculator
      • Pivot Points Calculator
      • Crypto Exchange Fees Calculator
      • Fibonacci Calculator
      • Forex Rebates
      • Margin Calculator
      • Compounding Calculator
      • Profit Calculator
      • Pip Calculator
      • Lot Size Calculator
      • Drawdown Calculator
    • Blog
    Join Telegram
    My Forex View
    Home » Technical Analysis – NZDUSD bears try to escape a range
    NZDUSD

    Technical Analysis – NZDUSD bears try to escape a range

    Charalampos PissourosBy Charalampos PissourosNovember 18, 2024No Comments2 Mins Read
    Facebook Twitter LinkedIn Pinterest Email
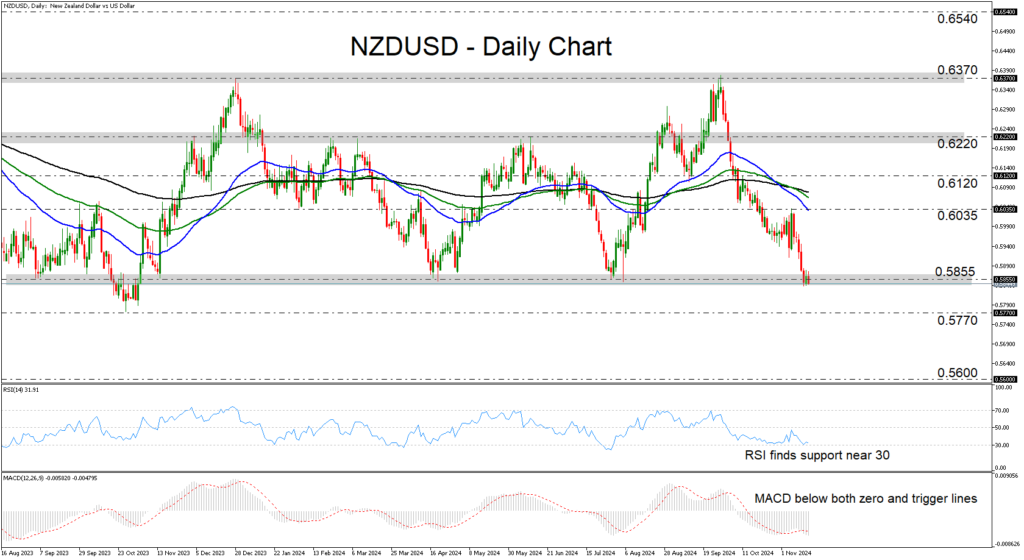
    • NZDUSD has been trading sideways for more than a year
    • Bears try to push below the key support of 0.5855
    • RSI and MACD detect bearish momentum
    • For the outlook to brighten, a move above 0.6220 may be needed

    NZDUSD has been falling since September 30, when it hit resistance near the 0.6370 zone, which stopped the bulls back in December 2023 as well. Overall, though, most of the price action had been contained between the 0.5855 and 0.6220 zones since July 2023, suggesting a neutral broader outlook.

    That said, today, the bears seem willing to push the battle below the 0.5855 territory, a move that may pave the way towards the low of October 26, 2023, at around 0.5770. If they are not willing to surrender there, they may then decide to dive all the way down to the 0.5600 barrier, marked by the low of October 21, 2022.

    Both the RSI and the MACD detect negative momentum. The former is lying near its 30 line, while the latter has been running below both its zero and trigger lines since last Tuesday. Nonetheless, the RSI has been repeatedly respecting its 30 line as support, which raises the likelihood for a potential rebound before the next leg south.

    If the recovery extends above 0.6035 though, this may be a sign that traders do not want to exit the range yet. The bulls may gain enough confidence to target the 0.6120 zone, the break of which could carry extensions towards the upper end of the aforementioned range at 0.6220. That said, for the picture to become brighter, a break higher may be needed.

    To sum up, NZDUSD has been trading in a trendless mode for more than a year, but the bears are now attempting to break lower. It will be interesting to see whether a move below 0.5855 will lead to larger declines.

    Share. Facebook Twitter Pinterest LinkedIn Telegram WhatsApp Copy Link
    Previous ArticleTechnical Analysis – Gold bulls make a move; need access above 2,600
    Next Article Technical Analysis – EURJPY correction halts at key support area

    Related Posts

    Technical Analysis

    Technical Analysis – USDJPY tests 158.00 level for first time in five months

    December 27, 2024
    Gold

    Technical Analysis – Gold returns above uptrend line

    December 23, 2024
    Technical Analysis

    Technical Analysis – USDCHF bulls are back and want to stay

    December 13, 2024
    Top Posts

    Get a Free Xmaster Formula Indicator Forex for MT4

    July 30, 2024102 Views

    Technical Analysis – ETHUSD trades flat after ETF debut

    July 25, 202446 Views

    Traders Dynamic Index (TDI): Best Strategies and Settings

    August 16, 202438 Views
    Stay In Touch
    • Facebook
    • YouTube
    • TikTok
    • WhatsApp
    • Twitter
    • Instagram

    Subscribe to Updates

    Get the latest tech news from FooBar about tech, design and biz.

    Most Popular

    Get a Free Xmaster Formula Indicator Forex for MT4

    July 30, 2024102 Views

    Technical Analysis – ETHUSD trades flat after ETF debut

    July 25, 202446 Views

    Traders Dynamic Index (TDI): Best Strategies and Settings

    August 16, 202438 Views
    Our Picks

    Technical Analysis – USDJPY tests 158.00 level for first time in five months

    December 27, 2024

    Daily Comment – Soft PCE inflation keeps rate cut hopes alive, but markets stay cautious

    December 23, 2024

    Technical Analysis – Gold returns above uptrend line

    December 23, 2024

    Subscribe to Updates

    Get the latest creative news from FooBar about art, design and business.

    Please enable JavaScript in your browser to complete this form.
    Loading
    © 2025 MyForexView.
    • Home
    • Analysis
    • Economic Calendar

    Type above and press Enter to search. Press Esc to cancel.