Close Menu
My Forex View

    Subscribe to Updates

    Get the latest creative news from FooBar about art, design and business.

    Please enable JavaScript in your browser to complete this form.
    Loading
    What's Hot

    Technical Analysis – USDJPY tests 158.00 level for first time in five months

    December 27, 2024

    Daily Comment – Soft PCE inflation keeps rate cut hopes alive, but markets stay cautious

    December 23, 2024

    Technical Analysis – Gold returns above uptrend line

    December 23, 2024
    Facebook X (Twitter) Instagram
    • Live Market
    • Learn Forex Trading
    • Technical Analysis
    Facebook X (Twitter) Instagram Pinterest Vimeo
    My Forex ViewMy Forex View
    • Home
    • Live Market
      • GBPUSD
      • EURUSD
      • USDJPY
      • XAUUSD
      • All Currency Pair
      • All Commodities Pair
    • Analysis
    • Free Forex Signals
    • Education
    • Tools
      • Economic Calendar
      • Currency Converter
      • Risk of Ruin Calculator
      • Pivot Points Calculator
      • Crypto Exchange Fees Calculator
      • Fibonacci Calculator
      • Forex Rebates
      • Margin Calculator
      • Compounding Calculator
      • Profit Calculator
      • Pip Calculator
      • Lot Size Calculator
      • Drawdown Calculator
    • Blog
    Join Telegram
    My Forex View
    Home » Technical Analysis – NZDUSD gets closer to a new 2024 low
    NZDUSD

    Technical Analysis – NZDUSD gets closer to a new 2024 low

    Achilleas GeorgolopoulosBy Achilleas GeorgolopoulosNovember 14, 2024No Comments2 Mins Read
    Facebook Twitter LinkedIn Pinterest Email
    • NZDUSD continues its sell-off
    • Post-US election reaction dictates price action
    • Momentum indicators have turned bearish

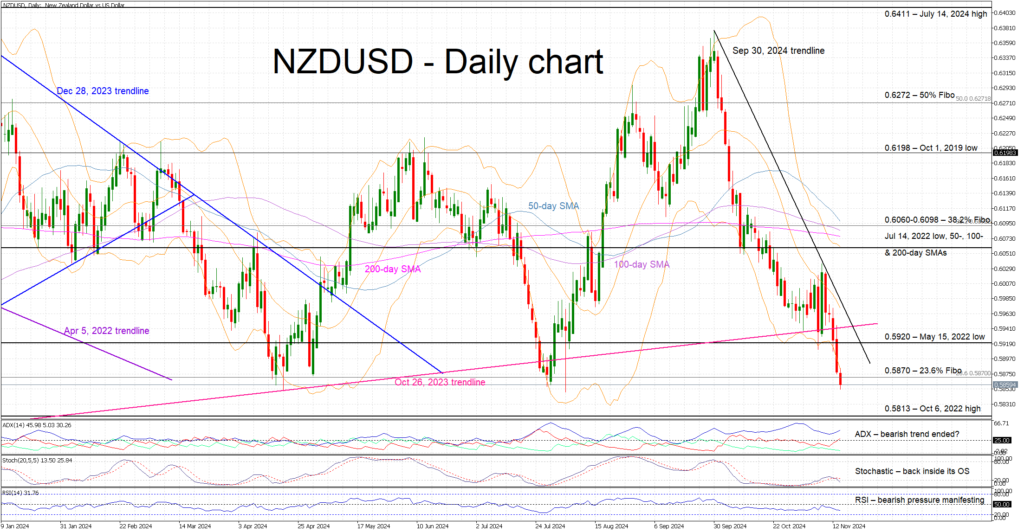
    NZDUSD is edging lower again today, recording its fifth consecutive red candle, and keeping the bearish trend from the September 30, 2024 trendline intact. NZDUSD has easily broken below the key October 24, 2023 ascending trendline, and it is now trying to achieve a daily close below by the 0.5870 level. The latest move is the combined result of the US presidential election boosting the dollar, and increased expectations of an aggressive RBNZ rate cut weakening the kiwi. 

    Meanwhile, the momentum indicators have turned bearish. Specifically, the RSI has dropped above its 50-midpoint, indicating that bearish pressure is increasing. Similarly, the Average Directional Movement Index (ADX) is edging higher and hence confirming the current bearish trend. More importantly, the stochastic oscillator has returned inside its oversold area (OS). It may stay there for a while before showing an appetite for a decisive move higher.

    If the bears remain confident, they could try to finally push NZDUSD below the 23.6% Fibonacci retracement of the April 5, 2022 – October 13, 2022 downtrend at 0.5870, and hence have the chance to record a new 2024 low. The door would then be open for a further selloff towards the October 6, 2022 high at 0.5813.

    On the other hand, the bulls are anxiously trying to regain market control and keep NZDUSD above 0.5870. If successful, they could then push NZDUSD above both the May 15, 2022 low at 0.5920 and the October 26, 2023 trendline. Higher, the path looks clear until the busy 0.6060-0.6098 range, which is defined by the 38.2% Fibonacci retracement, the July 14, 2022 low, and the 50-, 100- and 200-day simple moving average (SMAs).

    To sum up, NZDUSD bears are firmly in control and are potentially preparing for another selloff, if the post-US election euphoria lingers.

    Share. Facebook Twitter Pinterest LinkedIn Telegram WhatsApp Copy Link
    Previous ArticleTechnical Analysis – AUDUSD remains in the red; sellers seem cautious
    Next Article Daily Comment – Dollar wavers on US CPI, surges on hawkish Fed remarks

    Related Posts

    Technical Analysis

    Technical Analysis – USDJPY tests 158.00 level for first time in five months

    December 27, 2024
    Gold

    Technical Analysis – Gold returns above uptrend line

    December 23, 2024
    Technical Analysis

    Technical Analysis – USDCHF bulls are back and want to stay

    December 13, 2024
    Top Posts

    Get a Free Xmaster Formula Indicator Forex for MT4

    July 30, 2024102 Views

    Technical Analysis – ETHUSD trades flat after ETF debut

    July 25, 202446 Views

    Traders Dynamic Index (TDI): Best Strategies and Settings

    August 16, 202438 Views
    Stay In Touch
    • Facebook
    • YouTube
    • TikTok
    • WhatsApp
    • Twitter
    • Instagram

    Subscribe to Updates

    Get the latest tech news from FooBar about tech, design and biz.

    Most Popular

    Get a Free Xmaster Formula Indicator Forex for MT4

    July 30, 2024102 Views

    Technical Analysis – ETHUSD trades flat after ETF debut

    July 25, 202446 Views

    Traders Dynamic Index (TDI): Best Strategies and Settings

    August 16, 202438 Views
    Our Picks

    Technical Analysis – USDJPY tests 158.00 level for first time in five months

    December 27, 2024

    Daily Comment – Soft PCE inflation keeps rate cut hopes alive, but markets stay cautious

    December 23, 2024

    Technical Analysis – Gold returns above uptrend line

    December 23, 2024

    Subscribe to Updates

    Get the latest creative news from FooBar about art, design and business.

    Please enable JavaScript in your browser to complete this form.
    Loading
    © 2025 MyForexView.
    • Home
    • Analysis
    • Economic Calendar

    Type above and press Enter to search. Press Esc to cancel.