Close Menu
My Forex View

    Subscribe to Updates

    Get the latest creative news from FooBar about art, design and business.

    Please enable JavaScript in your browser to complete this form.
    Loading
    What's Hot

    Technical Analysis – USDJPY tests 158.00 level for first time in five months

    December 27, 2024

    Daily Comment – Soft PCE inflation keeps rate cut hopes alive, but markets stay cautious

    December 23, 2024

    Technical Analysis – Gold returns above uptrend line

    December 23, 2024
    Facebook X (Twitter) Instagram
    • Live Market
    • Learn Forex Trading
    • Technical Analysis
    Facebook X (Twitter) Instagram Pinterest Vimeo
    My Forex ViewMy Forex View
    • Home
    • Live Market
      • GBPUSD
      • EURUSD
      • USDJPY
      • XAUUSD
      • All Currency Pair
      • All Commodities Pair
    • Analysis
    • Free Forex Signals
    • Education
    • Tools
      • Economic Calendar
      • Currency Converter
      • Risk of Ruin Calculator
      • Pivot Points Calculator
      • Crypto Exchange Fees Calculator
      • Fibonacci Calculator
      • Forex Rebates
      • Margin Calculator
      • Compounding Calculator
      • Profit Calculator
      • Pip Calculator
      • Lot Size Calculator
      • Drawdown Calculator
    • Blog
    Join Telegram
    My Forex View
    Home » Technical Analysis – NZDUSD retreats below short-term uptrend line
    NZDUSD

    Technical Analysis – NZDUSD retreats below short-term uptrend line

    Melina DeltasBy Melina DeltasOctober 3, 2024Updated:November 7, 2024No Comments1 Min Read
    Facebook Twitter LinkedIn Pinterest Email
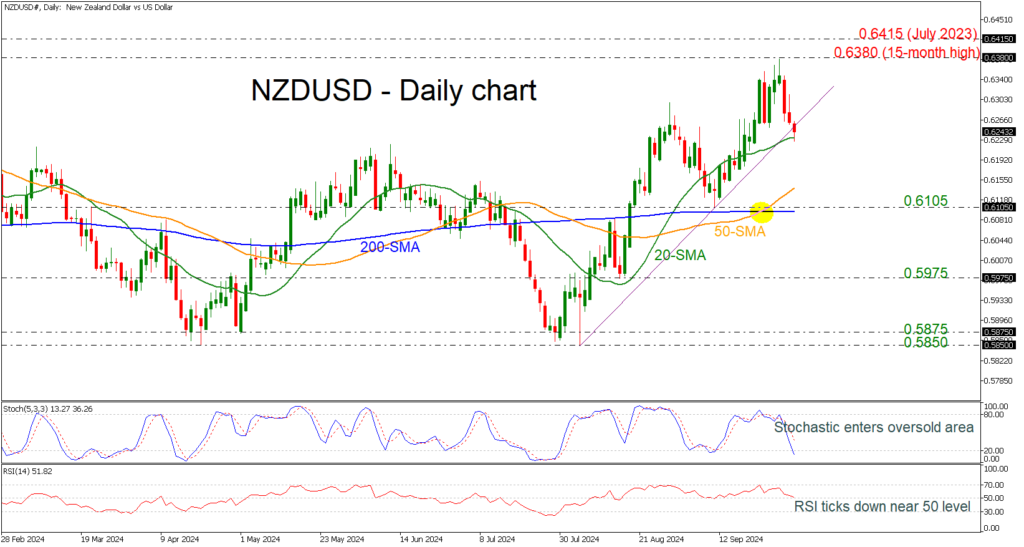
    • NZDUSD pulls back from its 15-month top
    • Stochastic tumbles to oversold region
    • RSI falls near 50 level

    NZDUSD lost more than 2% following the pullback from the 15-month high of 0.6380, flirting with the short-term ascending trend line and the 20-day simple moving average (SMA).

    In the previous days, the 50- and 200-day SMAs posted a bullish crossover, but the market is currently retreating, taking the technical oscillators lower. The stochastic dived towards the oversold region, while the RSI is trying to cross beneath the 50 level.

    The 20-day SMA at 0.6230 could provide immediate support, ahead of the 50-day SMA at 0.6140. Below that, the 0.6105 bar may halt bearish action, which holds near the flat 200-day SMA.

    On the flip side, if the market rises above the uptrend line, the next resistance could be the 15-month peak of 0.6380 and the July 2023 peak at 0.6415.

    All in all, NZDUSD has been in a bearish correction over the last couple of days, but as long as it remains above the 200-day SMA, the broader outlook remains positive.

    Source by: XM Global

    Share. Facebook Twitter Pinterest LinkedIn Telegram WhatsApp Copy Link
    Previous ArticleDaily Comment – Safe havens gain, stocks slip as Iran attacks Israel
    Next Article Daily Comment – Dollar extends gains on upbeat US data

    Related Posts

    Technical Analysis

    Technical Analysis – USDJPY tests 158.00 level for first time in five months

    December 27, 2024
    Gold

    Technical Analysis – Gold returns above uptrend line

    December 23, 2024
    Technical Analysis

    Technical Analysis – USDCHF bulls are back and want to stay

    December 13, 2024
    Top Posts

    Get a Free Xmaster Formula Indicator Forex for MT4

    July 30, 2024102 Views

    Technical Analysis – ETHUSD trades flat after ETF debut

    July 25, 202446 Views

    Traders Dynamic Index (TDI): Best Strategies and Settings

    August 16, 202438 Views
    Stay In Touch
    • Facebook
    • YouTube
    • TikTok
    • WhatsApp
    • Twitter
    • Instagram

    Subscribe to Updates

    Get the latest tech news from FooBar about tech, design and biz.

    Most Popular

    Get a Free Xmaster Formula Indicator Forex for MT4

    July 30, 2024102 Views

    Technical Analysis – ETHUSD trades flat after ETF debut

    July 25, 202446 Views

    Traders Dynamic Index (TDI): Best Strategies and Settings

    August 16, 202438 Views
    Our Picks

    Technical Analysis – USDJPY tests 158.00 level for first time in five months

    December 27, 2024

    Daily Comment – Soft PCE inflation keeps rate cut hopes alive, but markets stay cautious

    December 23, 2024

    Technical Analysis – Gold returns above uptrend line

    December 23, 2024

    Subscribe to Updates

    Get the latest creative news from FooBar about art, design and business.

    Please enable JavaScript in your browser to complete this form.
    Loading
    © 2025 MyForexView.
    • Home
    • Analysis
    • Economic Calendar

    Type above and press Enter to search. Press Esc to cancel.