Close Menu
My Forex View

    Subscribe to Updates

    Get the latest creative news from FooBar about art, design and business.

    Please enable JavaScript in your browser to complete this form.
    Loading
    What's Hot

    Technical Analysis – USDJPY tests 158.00 level for first time in five months

    December 27, 2024

    Daily Comment – Soft PCE inflation keeps rate cut hopes alive, but markets stay cautious

    December 23, 2024

    Technical Analysis – Gold returns above uptrend line

    December 23, 2024
    Facebook X (Twitter) Instagram
    • Live Market
    • Learn Forex Trading
    • Technical Analysis
    Facebook X (Twitter) Instagram Pinterest Vimeo
    My Forex ViewMy Forex View
    • Home
    • Live Market
      • GBPUSD
      • EURUSD
      • USDJPY
      • XAUUSD
      • All Currency Pair
      • All Commodities Pair
    • Analysis
    • Free Forex Signals
    • Education
    • Tools
      • Economic Calendar
      • Currency Converter
      • Risk of Ruin Calculator
      • Pivot Points Calculator
      • Crypto Exchange Fees Calculator
      • Fibonacci Calculator
      • Forex Rebates
      • Margin Calculator
      • Compounding Calculator
      • Profit Calculator
      • Pip Calculator
      • Lot Size Calculator
      • Drawdown Calculator
    • Blog
    Join Telegram
    My Forex View
    Home » Technical Analysis – US 100 index sits at key level
    Indices

    Technical Analysis – US 100 index sits at key level

    Christina ParthenidouBy Christina ParthenidouAugust 23, 2024Updated:November 7, 2024No Comments2 Mins Read
    Facebook Twitter LinkedIn Pinterest Email
    • US 100 index exhibits bearish tendencies but stabilizes near 50-SMA
    • Technical risk is two-sided as Powell prepares for his Jackson hole speech( 14:00 GMT)
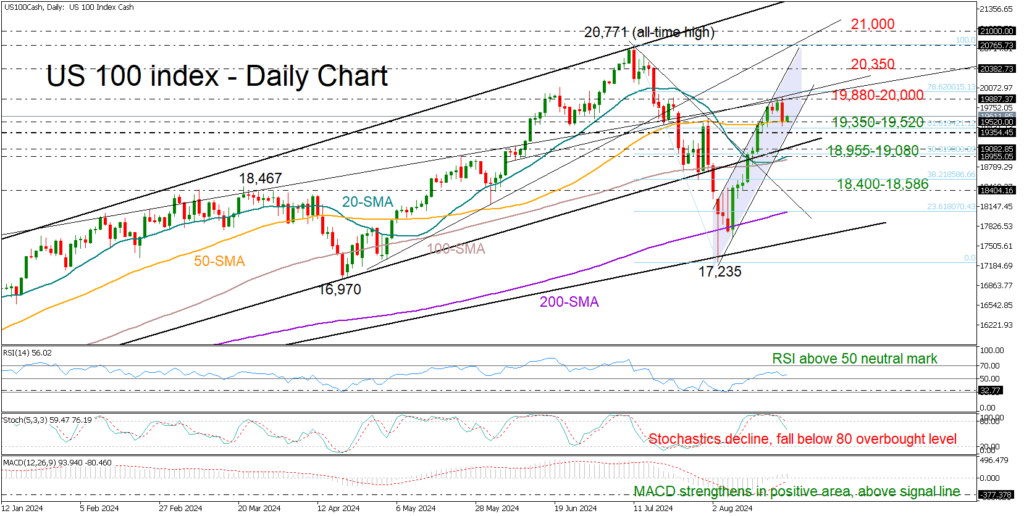
    • Bulls hope for a close above 19,880; bears need a drop below 19,350

    The US 100 stock index came under pressure on Thursday after a downward revision in the US non-farm payrolls revived fears of a slowing US economy.

    Fortunately, the 50-day simple moving average (SMA) prevented a further decline below 19,520, but the clear bearish engulfing candlestick pattern created at the top of the latest bullish wave both in the daily and four-hour charts warns that the selling wave might have more room to run.

    Meanwhile, the technical indicators have not confirmed a bearish bias yet. The RSI remains comfortably above its 50 neutral mark and the MACD continues to rise within the positive region, questioning the overbought signals coming from the stochastic oscillator.

    Nevertheless, if sellers drive the price below the 50-day SMA, they may instantly reach the channel’s lower boundary seen at 19,350. A steeper decline below the formation could cease somewhere between the support trendline from October at 19,080 and the 20-day SMA at 18,955. If this floor cracks as well, the index could crash into the 18,400-18,586 zone.

    Otherwise, should the index set a strong footing near its 50-day SMA, the bulls might again fight for a close above the 19,880-20,000 region. A successful break higher could pick up steam towards the channel’s upper band near 20,350, and then up to the all-time high of 20,771. The next mission could target the 21,000 psychological mark in uncharted territory.

    In brief, the US 100 index is in a state of neutrality and is looking for a new direction either below 19,350 or above 19,880.

    Source by: XM Global

    Share. Facebook Twitter Pinterest LinkedIn Telegram WhatsApp Copy Link
    Previous ArticleTechnical Analysis – USDCAD still fights with 1.3600
    Next Article Market Comment – Markets position ahead of Powell’s Jackson Hole speech

    Related Posts

    Indices

    Technical Analysis – Will the US 30 index face more setbacks?

    December 14, 2024
    Indices

    Technical Analysis – US 100 index rally loses steam

    November 27, 2024
    Indices

    Technical Analysis – US 30 index skyrockets after Trump’s victory

    November 6, 2024
    Top Posts

    Get a Free Xmaster Formula Indicator Forex for MT4

    July 30, 2024102 Views

    Technical Analysis – ETHUSD trades flat after ETF debut

    July 25, 202446 Views

    Traders Dynamic Index (TDI): Best Strategies and Settings

    August 16, 202438 Views
    Stay In Touch
    • Facebook
    • YouTube
    • TikTok
    • WhatsApp
    • Twitter
    • Instagram

    Subscribe to Updates

    Get the latest tech news from FooBar about tech, design and biz.

    Most Popular

    Get a Free Xmaster Formula Indicator Forex for MT4

    July 30, 2024102 Views

    Technical Analysis – ETHUSD trades flat after ETF debut

    July 25, 202446 Views

    Traders Dynamic Index (TDI): Best Strategies and Settings

    August 16, 202438 Views
    Our Picks

    Technical Analysis – USDJPY tests 158.00 level for first time in five months

    December 27, 2024

    Daily Comment – Soft PCE inflation keeps rate cut hopes alive, but markets stay cautious

    December 23, 2024

    Technical Analysis – Gold returns above uptrend line

    December 23, 2024

    Subscribe to Updates

    Get the latest creative news from FooBar about art, design and business.

    Please enable JavaScript in your browser to complete this form.
    Loading
    © 2025 MyForexView.
    • Home
    • Analysis
    • Economic Calendar

    Type above and press Enter to search. Press Esc to cancel.