Close Menu
My Forex View

    Subscribe to Updates

    Get the latest creative news from FooBar about art, design and business.

    Please enable JavaScript in your browser to complete this form.
    Loading
    What's Hot

    Technical Analysis – USDJPY tests 158.00 level for first time in five months

    December 27, 2024

    Daily Comment – Soft PCE inflation keeps rate cut hopes alive, but markets stay cautious

    December 23, 2024

    Technical Analysis – Gold returns above uptrend line

    December 23, 2024
    Facebook X (Twitter) Instagram
    • Live Market
    • Learn Forex Trading
    • Technical Analysis
    Facebook X (Twitter) Instagram Pinterest Vimeo
    My Forex ViewMy Forex View
    • Home
    • Live Market
      • GBPUSD
      • EURUSD
      • USDJPY
      • XAUUSD
      • All Currency Pair
      • All Commodities Pair
    • Analysis
    • Free Forex Signals
    • Education
    • Tools
      • Economic Calendar
      • Currency Converter
      • Risk of Ruin Calculator
      • Pivot Points Calculator
      • Crypto Exchange Fees Calculator
      • Fibonacci Calculator
      • Forex Rebates
      • Margin Calculator
      • Compounding Calculator
      • Profit Calculator
      • Pip Calculator
      • Lot Size Calculator
      • Drawdown Calculator
    • Blog
    Join Telegram
    My Forex View
    Home » Technical Analysis – US 100 index stops at uptrend line; positive risks not faded yet
    Indices

    Technical Analysis – US 100 index stops at uptrend line; positive risks not faded yet

    Melina DeltasBy Melina DeltasJuly 30, 2024Updated:November 7, 2024No Comments2 Mins Read
    Facebook Twitter LinkedIn Pinterest Email
    • US 100 heads up, standing beneath a short-term rising trend line
    • Stochastics point north above the oversold region
    • RSI ticks higher below the 50 level

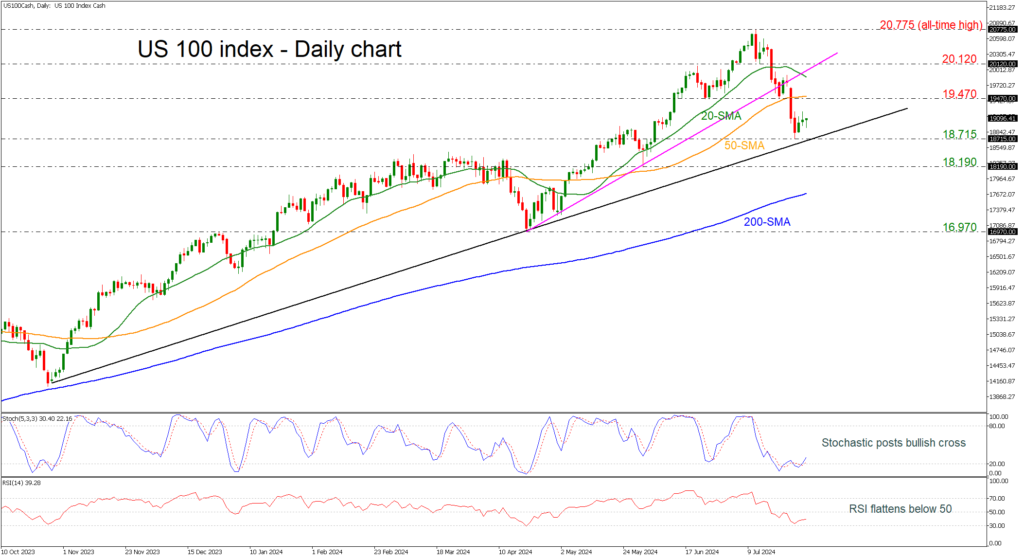
    The US 100 (cash) index had a strong pullback off the 18,715 support, failing to extend its dive from the all-time high of 20,775 below the long-term ascending trend line.

    Technically, the stochastic oscillator is moving up following the bullish crossover within its %K and %D lines in the oversold zone, while the RSI is ticking slightly up beneath the neutral threshold of 50. Also, the 20- and 50-day simple moving averages (SMAs) are heading down, approaching the current market price.

    If traders continue to buy the index, then the 50-day SMA near 19,470 resistance would be the first obstacle to look for ahead of the 20-day SMA at 19,875. A break above this level would shift the short-term outlook back to positive, taking the price above the near-term uptrend line at 20,120.

    In the event of a downside reversal and a closing session below the long-term ascending trend line, near the 18,715 support, it could open the way for a downside tendency, hitting 18,190. A strong barrier, though, could be found at the 200-day SMA at 17,690.

    In the bigger picture, the US 100 index is bullish as long as it holds above the 200-day SMA. If it violates this line, the bears would probably take the upper hand. 

    Source by: XM Global

    Share. Facebook Twitter Pinterest LinkedIn Telegram WhatsApp Copy Link
    Previous ArticleTechnical Analysis – GBPUSD extends pullback from 1-year high
    Next Article Technical Analysis – EURJPY stubbornly fights for an upturn

    Related Posts

    Indices

    Technical Analysis – Will the US 30 index face more setbacks?

    December 14, 2024
    Indices

    Technical Analysis – US 100 index rally loses steam

    November 27, 2024
    Indices

    Technical Analysis – US 30 index skyrockets after Trump’s victory

    November 6, 2024
    Top Posts

    Get a Free Xmaster Formula Indicator Forex for MT4

    July 30, 2024102 Views

    Technical Analysis – ETHUSD trades flat after ETF debut

    July 25, 202446 Views

    Traders Dynamic Index (TDI): Best Strategies and Settings

    August 16, 202438 Views
    Stay In Touch
    • Facebook
    • YouTube
    • TikTok
    • WhatsApp
    • Twitter
    • Instagram

    Subscribe to Updates

    Get the latest tech news from FooBar about tech, design and biz.

    Most Popular

    Get a Free Xmaster Formula Indicator Forex for MT4

    July 30, 2024102 Views

    Technical Analysis – ETHUSD trades flat after ETF debut

    July 25, 202446 Views

    Traders Dynamic Index (TDI): Best Strategies and Settings

    August 16, 202438 Views
    Our Picks

    Technical Analysis – USDJPY tests 158.00 level for first time in five months

    December 27, 2024

    Daily Comment – Soft PCE inflation keeps rate cut hopes alive, but markets stay cautious

    December 23, 2024

    Technical Analysis – Gold returns above uptrend line

    December 23, 2024

    Subscribe to Updates

    Get the latest creative news from FooBar about art, design and business.

    Please enable JavaScript in your browser to complete this form.
    Loading
    © 2025 MyForexView.
    • Home
    • Analysis
    • Economic Calendar

    Type above and press Enter to search. Press Esc to cancel.