Close Menu
My Forex View

    Subscribe to Updates

    Get the latest creative news from FooBar about art, design and business.

    Please enable JavaScript in your browser to complete this form.
    Loading
    What's Hot

    Technical Analysis – USDJPY tests 158.00 level for first time in five months

    December 27, 2024

    Daily Comment – Soft PCE inflation keeps rate cut hopes alive, but markets stay cautious

    December 23, 2024

    Technical Analysis – Gold returns above uptrend line

    December 23, 2024
    Facebook X (Twitter) Instagram
    • Live Market
    • Learn Forex Trading
    • Technical Analysis
    Facebook X (Twitter) Instagram Pinterest Vimeo
    My Forex ViewMy Forex View
    • Home
    • Live Market
      • GBPUSD
      • EURUSD
      • USDJPY
      • XAUUSD
      • All Currency Pair
      • All Commodities Pair
    • Analysis
    • Free Forex Signals
    • Education
    • Tools
      • Economic Calendar
      • Currency Converter
      • Risk of Ruin Calculator
      • Pivot Points Calculator
      • Crypto Exchange Fees Calculator
      • Fibonacci Calculator
      • Forex Rebates
      • Margin Calculator
      • Compounding Calculator
      • Profit Calculator
      • Pip Calculator
      • Lot Size Calculator
      • Drawdown Calculator
    • Blog
    Join Telegram
    My Forex View
    Home » Technical Analysis – US 30 index loses steam near July’s barrier
    Indices

    Technical Analysis – US 30 index loses steam near July’s barrier

    Christina ParthenidouBy Christina ParthenidouAugust 21, 2024Updated:November 7, 2024No Comments2 Mins Read
    Facebook Twitter LinkedIn Pinterest Email
    • US 30 recoups losses but cannot resume uptrend
    • Short-term bias is positive; confirmation awaited above 40,900
    • FOMC meeting minutes due at 18:00 GMT

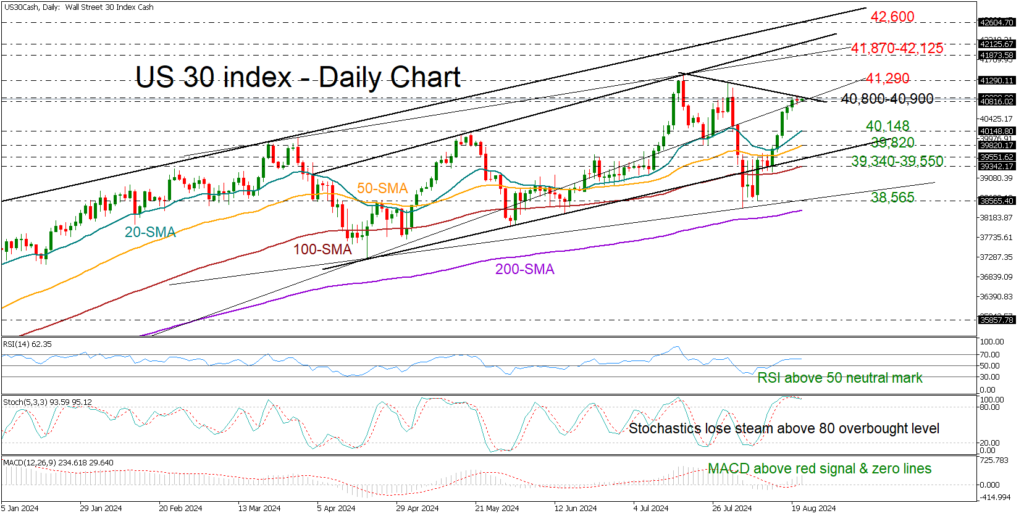
    Following a downturn at the beginning of the month, the US 30 index (cash) has made a strong comeback, although it encountered obstacles in surpassing the 40,900 threshold on Tuesday.

    The short-term resistance trendline that connects July’s highs is adding extra credence to the 40,900 regions, while the stochastic oscillator seems to be shifting downwards. Nevertheless, the RSI remains elevated within the bullish area above 50 and the MACD continues to strengthen above its red signal and zero lines, keeping the bias on the positive side, especially as long as the 40,800 floor holds.

    If the price slips beneath 40,800, it could seek shelter near the 20-day exponential moving average (EMA) at 40,148. The 50-day EMA could also protect the market near 39,820 ahead of the support trendline at 39,550. Should the bears breach the 100-day EMA at 39,342 too, the index could experience a rapid downfall towards the August floor of 38,565.

    In the bullish scenario the price crawls above the tough resistance of 40,900, the bulls might initially fight the 41,290 bar and then try to reach a new milestone near 41,870 or higher at 42,125. Beyond the latter, the uptrend could stretch towards the tentative resistance trendline from July 2023 at 42,600.

    Summing up, the US 30 index is within a tight neutral zone, waiting for a close above 40,900 or below 40,800 to get a fresh direction.

    Source by: XM Global

    Share. Facebook Twitter Pinterest LinkedIn Telegram WhatsApp Copy Link
    Previous ArticleTechnical Analysis – EURUSD bulls stay in charge
    Next Article Technical Analysis – AUDUSD loses some positive momentum

    Related Posts

    Indices

    Technical Analysis – Will the US 30 index face more setbacks?

    December 14, 2024
    Indices

    Technical Analysis – US 100 index rally loses steam

    November 27, 2024
    Indices

    Technical Analysis – US 30 index skyrockets after Trump’s victory

    November 6, 2024
    Top Posts

    Get a Free Xmaster Formula Indicator Forex for MT4

    July 30, 2024102 Views

    Technical Analysis – ETHUSD trades flat after ETF debut

    July 25, 202446 Views

    Traders Dynamic Index (TDI): Best Strategies and Settings

    August 16, 202438 Views
    Stay In Touch
    • Facebook
    • YouTube
    • TikTok
    • WhatsApp
    • Twitter
    • Instagram

    Subscribe to Updates

    Get the latest tech news from FooBar about tech, design and biz.

    Most Popular

    Get a Free Xmaster Formula Indicator Forex for MT4

    July 30, 2024102 Views

    Technical Analysis – ETHUSD trades flat after ETF debut

    July 25, 202446 Views

    Traders Dynamic Index (TDI): Best Strategies and Settings

    August 16, 202438 Views
    Our Picks

    Technical Analysis – USDJPY tests 158.00 level for first time in five months

    December 27, 2024

    Daily Comment – Soft PCE inflation keeps rate cut hopes alive, but markets stay cautious

    December 23, 2024

    Technical Analysis – Gold returns above uptrend line

    December 23, 2024

    Subscribe to Updates

    Get the latest creative news from FooBar about art, design and business.

    Please enable JavaScript in your browser to complete this form.
    Loading
    © 2025 MyForexView.
    • Home
    • Analysis
    • Economic Calendar

    Type above and press Enter to search. Press Esc to cancel.