Close Menu
My Forex View

    Subscribe to Updates

    Get the latest creative news from FooBar about art, design and business.

    Please enable JavaScript in your browser to complete this form.
    Loading
    What's Hot

    Technical Analysis – USDJPY tests 158.00 level for first time in five months

    December 27, 2024

    Daily Comment – Soft PCE inflation keeps rate cut hopes alive, but markets stay cautious

    December 23, 2024

    Technical Analysis – Gold returns above uptrend line

    December 23, 2024
    Facebook X (Twitter) Instagram
    • Live Market
    • Learn Forex Trading
    • Technical Analysis
    Facebook X (Twitter) Instagram Pinterest Vimeo
    My Forex ViewMy Forex View
    • Home
    • Live Market
      • GBPUSD
      • EURUSD
      • USDJPY
      • XAUUSD
      • All Currency Pair
      • All Commodities Pair
    • Analysis
    • Free Forex Signals
    • Education
    • Tools
      • Economic Calendar
      • Currency Converter
      • Risk of Ruin Calculator
      • Pivot Points Calculator
      • Crypto Exchange Fees Calculator
      • Fibonacci Calculator
      • Forex Rebates
      • Margin Calculator
      • Compounding Calculator
      • Profit Calculator
      • Pip Calculator
      • Lot Size Calculator
      • Drawdown Calculator
    • Blog
    Join Telegram
    My Forex View
    Home » Technical Analysis – US 500 calms down after hitting new record high
    Indices

    Technical Analysis – US 500 calms down after hitting new record high

    Melina DeltasBy Melina DeltasSeptember 30, 2024Updated:November 7, 2024No Comments1 Min Read
    Facebook Twitter LinkedIn Pinterest Email
    • US 500 index climbed to new record highs last week
    • But got rejected and has retreated a little since
    • MACD and RSI look overbought

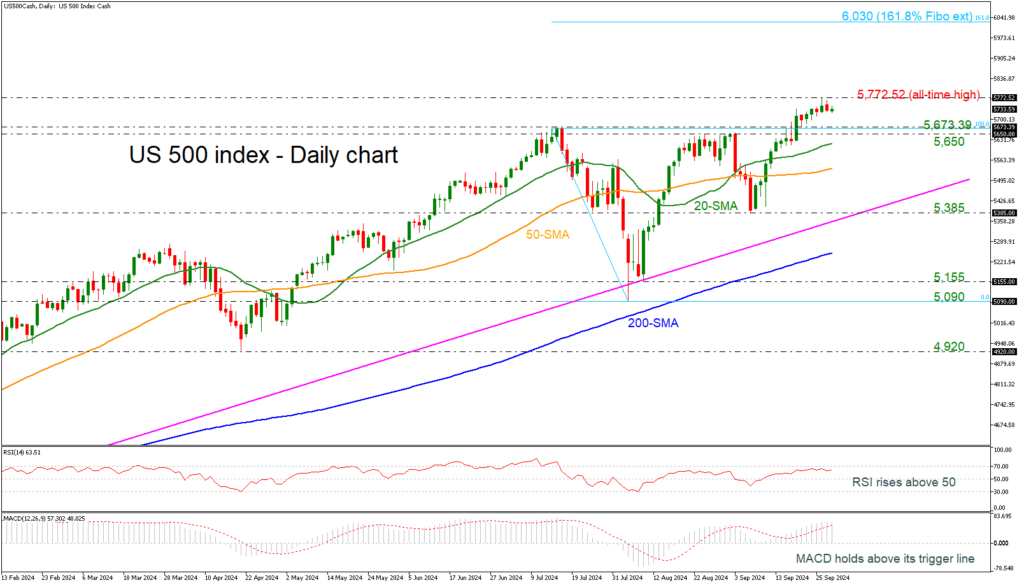
    Following the bounce off the 5,385 support level, the US 500 (cash) index added more than 7%, reaching an all-time high of 5,772.52 last week. Technically, the index is sailing near overbought waters, according to the MACD oscillator. The RSI is also flagging a potential downfall, as it’s losing impetus slightly below 70.

    If buyers stay in play, the door will open for the next round numbers, such as 5,800 and 5,900, until the price moves up to the 161.8% Fibonacci extension level of the downward wave from 5,673.39 to 5,090 at 6,030.

    If the bears press the price below 5,673.39-5,650, the 20- and 50-day simple moving averages (SMAs) may prevent a downfall towards the 5,385 support level. If the latter gives way, the decline could continue toward the 200-day SMA at 5,250.

    In a nutshell, despite the latest exciting rebound in the US 500 index, the momentum oscillators are indicating a bearish correction in the short-term view.

    Source by: XM Global

    Share. Facebook Twitter Pinterest LinkedIn Telegram WhatsApp Copy Link
    Previous ArticleTechnical Analysis – EURCHF trades higher, inside a developing pattern
    Next Article Daily Comment – PCE inflation corroborates dovish Fed bets

    Related Posts

    Indices

    Technical Analysis – Will the US 30 index face more setbacks?

    December 14, 2024
    Indices

    Technical Analysis – US 100 index rally loses steam

    November 27, 2024
    Indices

    Technical Analysis – US 30 index skyrockets after Trump’s victory

    November 6, 2024
    Top Posts

    Get a Free Xmaster Formula Indicator Forex for MT4

    July 30, 2024102 Views

    Technical Analysis – ETHUSD trades flat after ETF debut

    July 25, 202446 Views

    Traders Dynamic Index (TDI): Best Strategies and Settings

    August 16, 202438 Views
    Stay In Touch
    • Facebook
    • YouTube
    • TikTok
    • WhatsApp
    • Twitter
    • Instagram

    Subscribe to Updates

    Get the latest tech news from FooBar about tech, design and biz.

    Most Popular

    Get a Free Xmaster Formula Indicator Forex for MT4

    July 30, 2024102 Views

    Technical Analysis – ETHUSD trades flat after ETF debut

    July 25, 202446 Views

    Traders Dynamic Index (TDI): Best Strategies and Settings

    August 16, 202438 Views
    Our Picks

    Technical Analysis – USDJPY tests 158.00 level for first time in five months

    December 27, 2024

    Daily Comment – Soft PCE inflation keeps rate cut hopes alive, but markets stay cautious

    December 23, 2024

    Technical Analysis – Gold returns above uptrend line

    December 23, 2024

    Subscribe to Updates

    Get the latest creative news from FooBar about art, design and business.

    Please enable JavaScript in your browser to complete this form.
    Loading
    © 2025 MyForexView.
    • Home
    • Analysis
    • Economic Calendar

    Type above and press Enter to search. Press Esc to cancel.