Close Menu
My Forex View

    Subscribe to Updates

    Get the latest creative news from FooBar about art, design and business.

    Please enable JavaScript in your browser to complete this form.
    Loading
    What's Hot

    Technical Analysis – USDJPY tests 158.00 level for first time in five months

    December 27, 2024

    Daily Comment – Soft PCE inflation keeps rate cut hopes alive, but markets stay cautious

    December 23, 2024

    Technical Analysis – Gold returns above uptrend line

    December 23, 2024
    Facebook X (Twitter) Instagram
    • Live Market
    • Learn Forex Trading
    • Technical Analysis
    Facebook X (Twitter) Instagram Pinterest Vimeo
    My Forex ViewMy Forex View
    • Home
    • Live Market
      • GBPUSD
      • EURUSD
      • USDJPY
      • XAUUSD
      • All Currency Pair
      • All Commodities Pair
    • Analysis
    • Free Forex Signals
    • Education
    • Tools
      • Economic Calendar
      • Currency Converter
      • Risk of Ruin Calculator
      • Pivot Points Calculator
      • Crypto Exchange Fees Calculator
      • Fibonacci Calculator
      • Forex Rebates
      • Margin Calculator
      • Compounding Calculator
      • Profit Calculator
      • Pip Calculator
      • Lot Size Calculator
      • Drawdown Calculator
    • Blog
    Join Telegram
    My Forex View
    Home » Technical Analysis – US 500 index recoups some losses in short-term
    Indices

    Technical Analysis – US 500 index recoups some losses in short-term

    Melina DeltasBy Melina DeltasNovember 5, 2024Updated:November 7, 2024No Comments2 Mins Read
    Facebook Twitter LinkedIn Pinterest Email
    • US 500 index rebounds off 50-day SMA
    • RSI and MACD weaken their momentum

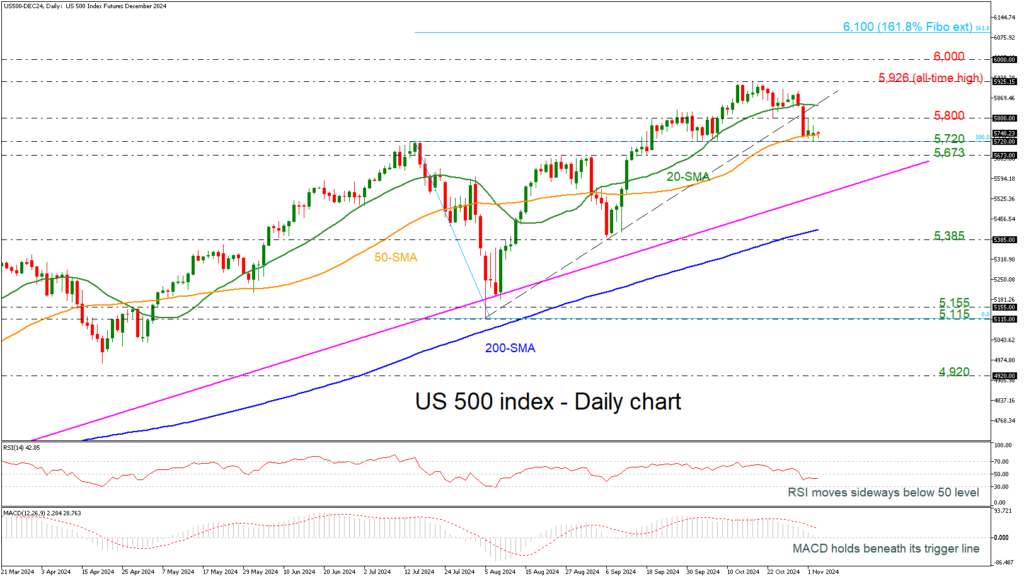
    The US 500 index has paused its bearish correction near the 5,720 support level and the 50-day simple moving average (SMA).

    The price is currently standing beneath the short-term uptrend line, with the technical oscillators indicating weakening momentum. The RSI is moving sideways beneath the neutral threshold of 50, while the MACD is heading south below its trigger line and near the zero level.

    In case of steeper decreases, it could drive the market until the 5,673 barrier before testing the long-term ascending trend line around 5,550. If the bears gain control over the broader picture, the index could potentially reach the 200-day SMA at 5,420.

    In the positive scenario, a climb beyond the 5,800 resistance could lead the market towards the 20-day SMA at 5,845 ahead of the all-time peak of 5,926, printed on October 17. Further upside movement could see the 6,000 psychological mark before challenging the 161.8% Fibonacci extension level of the down leg from 5,720 to 5,115 at 6,100.

    Overall, the US 500 index maintains a strong bullish tendency in the long-term view, with the market maintaining a strong position above both the long-term rising trend line and the 200-day SMA. To confirm an upside recovery in the near term, a climb above the 5,800 resistance is necessary.

    Source by: XM Global

    Share. Facebook Twitter Pinterest LinkedIn Telegram WhatsApp Copy Link
    Previous ArticleTechnical Analysis – EURJPY builds base above 200-day SMA
    Next Article Technical Analysis – EURUSD makes soft positive start on US election day

    Related Posts

    Indices

    Technical Analysis – Will the US 30 index face more setbacks?

    December 14, 2024
    Indices

    Technical Analysis – US 100 index rally loses steam

    November 27, 2024
    Indices

    Technical Analysis – US 30 index skyrockets after Trump’s victory

    November 6, 2024
    Top Posts

    Get a Free Xmaster Formula Indicator Forex for MT4

    July 30, 2024102 Views

    Technical Analysis – ETHUSD trades flat after ETF debut

    July 25, 202446 Views

    Traders Dynamic Index (TDI): Best Strategies and Settings

    August 16, 202438 Views
    Stay In Touch
    • Facebook
    • YouTube
    • TikTok
    • WhatsApp
    • Twitter
    • Instagram

    Subscribe to Updates

    Get the latest tech news from FooBar about tech, design and biz.

    Most Popular

    Get a Free Xmaster Formula Indicator Forex for MT4

    July 30, 2024102 Views

    Technical Analysis – ETHUSD trades flat after ETF debut

    July 25, 202446 Views

    Traders Dynamic Index (TDI): Best Strategies and Settings

    August 16, 202438 Views
    Our Picks

    Technical Analysis – USDJPY tests 158.00 level for first time in five months

    December 27, 2024

    Daily Comment – Soft PCE inflation keeps rate cut hopes alive, but markets stay cautious

    December 23, 2024

    Technical Analysis – Gold returns above uptrend line

    December 23, 2024

    Subscribe to Updates

    Get the latest creative news from FooBar about art, design and business.

    Please enable JavaScript in your browser to complete this form.
    Loading
    © 2025 MyForexView.
    • Home
    • Analysis
    • Economic Calendar

    Type above and press Enter to search. Press Esc to cancel.