Close Menu
My Forex View

    Subscribe to Updates

    Get the latest creative news from FooBar about art, design and business.

    Please enable JavaScript in your browser to complete this form.
    Loading
    What's Hot

    Technical Analysis – USDJPY tests 158.00 level for first time in five months

    December 27, 2024

    Daily Comment – Soft PCE inflation keeps rate cut hopes alive, but markets stay cautious

    December 23, 2024

    Technical Analysis – Gold returns above uptrend line

    December 23, 2024
    Facebook X (Twitter) Instagram
    • Live Market
    • Learn Forex Trading
    • Technical Analysis
    Facebook X (Twitter) Instagram Pinterest Vimeo
    My Forex ViewMy Forex View
    • Home
    • Live Market
      • GBPUSD
      • EURUSD
      • USDJPY
      • XAUUSD
      • All Currency Pair
      • All Commodities Pair
    • Analysis
    • Free Forex Signals
    • Education
    • Tools
      • Economic Calendar
      • Currency Converter
      • Risk of Ruin Calculator
      • Pivot Points Calculator
      • Crypto Exchange Fees Calculator
      • Fibonacci Calculator
      • Forex Rebates
      • Margin Calculator
      • Compounding Calculator
      • Profit Calculator
      • Pip Calculator
      • Lot Size Calculator
      • Drawdown Calculator
    • Blog
    Join Telegram
    My Forex View
    Home » Technical Analysis – US 500 index slips after 10% recovery
    Indices

    Technical Analysis – US 500 index slips after 10% recovery

    Melina DeltasBy Melina DeltasAugust 19, 2024Updated:November 7, 2024No Comments2 Mins Read
    Facebook Twitter LinkedIn Pinterest Email
    • The US 500 index rises above the long-term uptrend line
    • 200-day SMA still holds well
    • Stochastic and RSI indicate an overstretched market

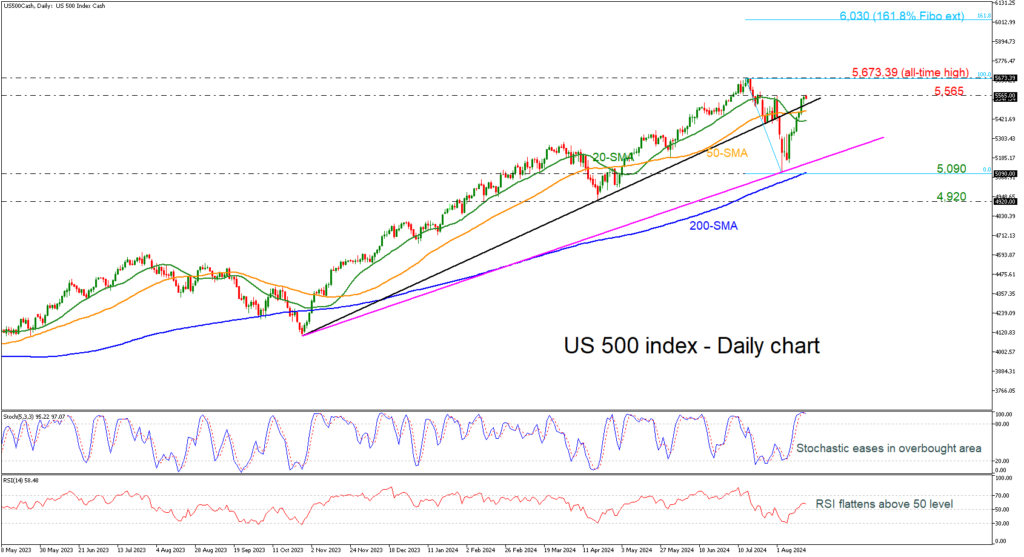
    The US 500 cash index recovered by almost 10% from the bearish wave that started from the all-time high of 5,673.39 and is currently returning to a position above the long-term ascending trend line. The index found strong support at the 2,090 support level, which stands near the 200-day simple moving average (SMA).

    Technically, the price is hovering above the short-term SMAs, but the momentum oscillators indicate an overstretched market with a potential downside retracement again. In the overbought area, the stochastic posted a bearish crossover within its %K and %D lines, while the RSI is ticking south above the 50 level.

    If price action rises above the immediate resistance of 5,565, there is potential for it to test the record peak of 5,673.39. Rising above that point, the next round numbers, such as 5,800 and 5,900, could be significant resistance levels before hitting the 161.8% Fibonacci extension level of the downward wave from 5,673.39 to 5,090 at 6,030.

    On the flip side, a successful dive beneath the uptrend line could meet the 50- and then the 20-day SMAs at 5,478 and 5,412 respectively before plunging to the 200-day SMA near 5,090.

    As the market holds above the 200-day SMA the broader outlook is looking bullish. Near-term weakness is expected to remain as long as technical oscillators show negative signs.

    Source by: XM Global

    Share. Facebook Twitter Pinterest LinkedIn Telegram WhatsApp Copy Link
    Previous ArticleTechnical Analysis – EURUSD tests 1.1050 tricky area
    Next Article Technical Analysis – Gold surges to fresh record high

    Related Posts

    Indices

    Technical Analysis – Will the US 30 index face more setbacks?

    December 14, 2024
    Indices

    Technical Analysis – US 100 index rally loses steam

    November 27, 2024
    Indices

    Technical Analysis – US 30 index skyrockets after Trump’s victory

    November 6, 2024
    Top Posts

    Get a Free Xmaster Formula Indicator Forex for MT4

    July 30, 2024105 Views

    Technical Analysis – ETHUSD trades flat after ETF debut

    July 25, 202448 Views

    Traders Dynamic Index (TDI): Best Strategies and Settings

    August 16, 202444 Views
    Stay In Touch
    • Facebook
    • YouTube
    • TikTok
    • WhatsApp
    • Twitter
    • Instagram

    Subscribe to Updates

    Get the latest tech news from FooBar about tech, design and biz.

    Most Popular

    Get a Free Xmaster Formula Indicator Forex for MT4

    July 30, 2024105 Views

    Technical Analysis – ETHUSD trades flat after ETF debut

    July 25, 202448 Views

    Traders Dynamic Index (TDI): Best Strategies and Settings

    August 16, 202444 Views
    Our Picks

    Technical Analysis – USDJPY tests 158.00 level for first time in five months

    December 27, 2024

    Daily Comment – Soft PCE inflation keeps rate cut hopes alive, but markets stay cautious

    December 23, 2024

    Technical Analysis – Gold returns above uptrend line

    December 23, 2024

    Subscribe to Updates

    Get the latest creative news from FooBar about art, design and business.

    Please enable JavaScript in your browser to complete this form.
    Loading
    © 2025 MyForexView.
    • Home
    • Analysis
    • Economic Calendar

    Type above and press Enter to search. Press Esc to cancel.