Close Menu
My Forex View

    Subscribe to Updates

    Get the latest creative news from FooBar about art, design and business.

    Please enable JavaScript in your browser to complete this form.
    Loading
    What's Hot

    Technical Analysis – USDJPY tests 158.00 level for first time in five months

    December 27, 2024

    Daily Comment – Soft PCE inflation keeps rate cut hopes alive, but markets stay cautious

    December 23, 2024

    Technical Analysis – Gold returns above uptrend line

    December 23, 2024
    Facebook X (Twitter) Instagram
    • Live Market
    • Learn Forex Trading
    • Technical Analysis
    Facebook X (Twitter) Instagram Pinterest Vimeo
    My Forex ViewMy Forex View
    • Home
    • Live Market
      • GBPUSD
      • EURUSD
      • USDJPY
      • XAUUSD
      • All Currency Pair
      • All Commodities Pair
    • Analysis
    • Free Forex Signals
    • Education
    • Tools
      • Economic Calendar
      • Currency Converter
      • Risk of Ruin Calculator
      • Pivot Points Calculator
      • Crypto Exchange Fees Calculator
      • Fibonacci Calculator
      • Forex Rebates
      • Margin Calculator
      • Compounding Calculator
      • Profit Calculator
      • Pip Calculator
      • Lot Size Calculator
      • Drawdown Calculator
    • Blog
    Join Telegram
    My Forex View
    Home » Technical Analysis – USDCAD bears take a break but are not done yet
    Technical Analysis

    Technical Analysis – USDCAD bears take a break but are not done yet

    Christina ParthenidouBy Christina ParthenidouAugust 9, 2024Updated:November 7, 2024No Comments2 Mins Read
    Facebook Twitter LinkedIn Pinterest Email
    • USDCAD experiences worst week of the year
    • Selling pressure might persist; eyes on 1.3730
    • Canadian employment figures due at 12:30 GMT

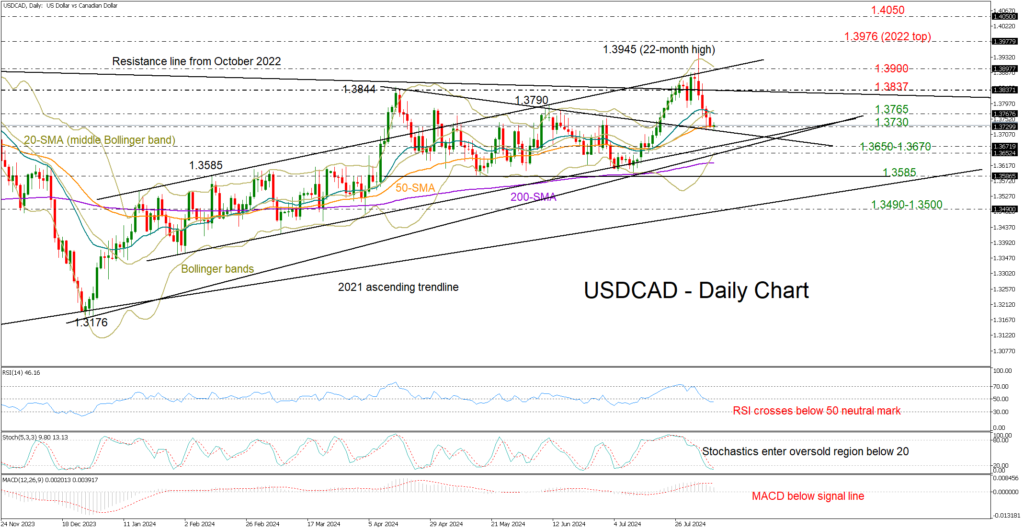
    Since reaching a 22-month high of 1.3945, USDCAD has been steadily dropping towards its 50-day SMA at 1.3730, making it the worst-performing week of the year.

    The broken resistance trendline drawn from April’s peak is now providing support in the market, although there is no certainty of a bullish rotation according to the technical indicators.

    Even though the Stochastic oscillator has entered its oversold territory, the negative cycles in the RSI and the MACD seem to be at an early stage, warning that the bearish wave in the price has yet to bottom out. Note that the price is trading comfortably above the lower Bollinger band, endorsing the bearish scenario too.

    The next pivot point could develop between the ascending trendlines coming from December 2023 and January 2024 at 1.3670 and 1.3650 respectively. If selling forces breach that floor, the pair could tumble towards the critical 1.3585 base, a break of which would violate the horizontal move from April, likely prompting a fast decline towards the 2021 ascending trendline at 1.3500.

    If the pair attracts new buyers around 1.3730, it may encounter resistance near the 20-day SMA at 1.3765. A step higher could face resistance around the constraining line from October 2022 at 1.3837, while higher, the bulls might push towards the 1.3900 barrier.

    Summing up, USDCAD could remain under pressure as the bears seem to have the upper hand in the market. A close below 1.3730 might trigger the next downfall.

    Source by: XM Global

    Share. Facebook Twitter Pinterest LinkedIn Telegram WhatsApp Copy Link
    Previous ArticleTechnical Analysis – GBPJPY climb continues
    Next Article Market Comment – Sentiment improves after drop in US jobless claims

    Related Posts

    Technical Analysis

    Technical Analysis – USDJPY tests 158.00 level for first time in five months

    December 27, 2024
    Gold

    Technical Analysis – Gold returns above uptrend line

    December 23, 2024
    Technical Analysis

    Technical Analysis – USDCHF bulls are back and want to stay

    December 13, 2024
    Top Posts

    Get a Free Xmaster Formula Indicator Forex for MT4

    July 30, 2024102 Views

    Technical Analysis – ETHUSD trades flat after ETF debut

    July 25, 202446 Views

    Traders Dynamic Index (TDI): Best Strategies and Settings

    August 16, 202438 Views
    Stay In Touch
    • Facebook
    • YouTube
    • TikTok
    • WhatsApp
    • Twitter
    • Instagram

    Subscribe to Updates

    Get the latest tech news from FooBar about tech, design and biz.

    Most Popular

    Get a Free Xmaster Formula Indicator Forex for MT4

    July 30, 2024102 Views

    Technical Analysis – ETHUSD trades flat after ETF debut

    July 25, 202446 Views

    Traders Dynamic Index (TDI): Best Strategies and Settings

    August 16, 202438 Views
    Our Picks

    Technical Analysis – USDJPY tests 158.00 level for first time in five months

    December 27, 2024

    Daily Comment – Soft PCE inflation keeps rate cut hopes alive, but markets stay cautious

    December 23, 2024

    Technical Analysis – Gold returns above uptrend line

    December 23, 2024

    Subscribe to Updates

    Get the latest creative news from FooBar about art, design and business.

    Please enable JavaScript in your browser to complete this form.
    Loading
    © 2025 MyForexView.
    • Home
    • Analysis
    • Economic Calendar

    Type above and press Enter to search. Press Esc to cancel.