Close Menu
My Forex View

    Subscribe to Updates

    Get the latest creative news from FooBar about art, design and business.

    Please enable JavaScript in your browser to complete this form.
    Loading
    What's Hot

    Technical Analysis – USDJPY tests 158.00 level for first time in five months

    December 27, 2024

    Daily Comment – Soft PCE inflation keeps rate cut hopes alive, but markets stay cautious

    December 23, 2024

    Technical Analysis – Gold returns above uptrend line

    December 23, 2024
    Facebook X (Twitter) Instagram
    • Live Market
    • Learn Forex Trading
    • Technical Analysis
    Facebook X (Twitter) Instagram Pinterest Vimeo
    My Forex ViewMy Forex View
    • Home
    • Live Market
      • GBPUSD
      • EURUSD
      • USDJPY
      • XAUUSD
      • All Currency Pair
      • All Commodities Pair
    • Analysis
    • Free Forex Signals
    • Education
    • Tools
      • Economic Calendar
      • Currency Converter
      • Risk of Ruin Calculator
      • Pivot Points Calculator
      • Crypto Exchange Fees Calculator
      • Fibonacci Calculator
      • Forex Rebates
      • Margin Calculator
      • Compounding Calculator
      • Profit Calculator
      • Pip Calculator
      • Lot Size Calculator
      • Drawdown Calculator
    • Blog
    Join Telegram
    My Forex View
    Home » Technical Analysis – USDCHF eyes August’s low as bears stay in charge
    Technical Analysis

    Technical Analysis – USDCHF eyes August’s low as bears stay in charge

    Christina ParthenidouBy Christina ParthenidouSeptember 5, 2024Updated:November 7, 2024No Comments2 Mins Read
    Facebook Twitter LinkedIn Pinterest Email
    • USDCHF trims latest rebound, holds bearish trend ahead of US data
    • Short-term bias skewed to the downside; bears wait for a move below 0.8435

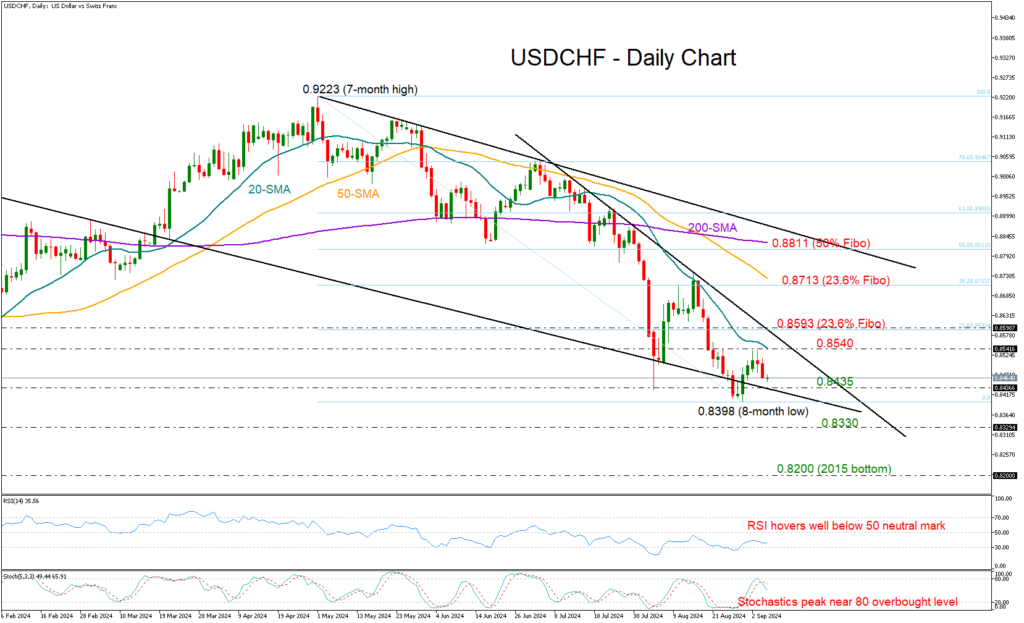
    USDCHF has been stuck in a downward trend since April’s peak of 0.9223, unable to sustain any bullish corrections. More recently, following its bounce from an eight-month low of 0.8398, the price is once again subject to downward pressure.

    With the RSI hovering well below its 50 neutral mark and the stochastic oscillator having peaked in the overbought zone, there is little hope for a meaningful rally.

    A step below 0.8435 might re-examine the 0.8400 round level, which the bears could not successfully claim in August. If that base collapses this time, the price might next head for the December 2023 trough of 0.8330. A violation there could significantly worsen the broader outlook, opening the door for the 2015 bottom of 0.8200.

    If the pair manages to drift higher, resistance could initially emerge between the 20-day simple moving average (SMA) and the 23.6% Fibonacci retracement of the April-August downtrend at 0.8593. A victory there could bolster buying appetite, lifting the price rapidly to the 38.2% Fibonacci number of 0.8713. Note that the 50-day SMA is within the neighborhood. Therefore, a breakthrough above it may result in a quick rally towards the 50% Fibonacci level of 0.8811 and the 200-day SMA.

    Overall, USDCHF is in a bearish trend and could face additional losses if the 0.8435 region is breached.

    Source by: XM Global

    Share. Facebook Twitter Pinterest LinkedIn Telegram WhatsApp Copy Link
    Previous ArticleTechnical Analysis – Bitcoin slides and hits the 56,200 support
    Next Article Midweek Technical Look – EURUSD, US 500, oil

    Related Posts

    Technical Analysis

    Technical Analysis – USDJPY tests 158.00 level for first time in five months

    December 27, 2024
    Gold

    Technical Analysis – Gold returns above uptrend line

    December 23, 2024
    Technical Analysis

    Technical Analysis – USDCHF bulls are back and want to stay

    December 13, 2024
    Top Posts

    Get a Free Xmaster Formula Indicator Forex for MT4

    July 30, 2024102 Views

    Technical Analysis – ETHUSD trades flat after ETF debut

    July 25, 202446 Views

    Traders Dynamic Index (TDI): Best Strategies and Settings

    August 16, 202438 Views
    Stay In Touch
    • Facebook
    • YouTube
    • TikTok
    • WhatsApp
    • Twitter
    • Instagram

    Subscribe to Updates

    Get the latest tech news from FooBar about tech, design and biz.

    Most Popular

    Get a Free Xmaster Formula Indicator Forex for MT4

    July 30, 2024102 Views

    Technical Analysis – ETHUSD trades flat after ETF debut

    July 25, 202446 Views

    Traders Dynamic Index (TDI): Best Strategies and Settings

    August 16, 202438 Views
    Our Picks

    Technical Analysis – USDJPY tests 158.00 level for first time in five months

    December 27, 2024

    Daily Comment – Soft PCE inflation keeps rate cut hopes alive, but markets stay cautious

    December 23, 2024

    Technical Analysis – Gold returns above uptrend line

    December 23, 2024

    Subscribe to Updates

    Get the latest creative news from FooBar about art, design and business.

    Please enable JavaScript in your browser to complete this form.
    Loading
    © 2025 MyForexView.
    • Home
    • Analysis
    • Economic Calendar

    Type above and press Enter to search. Press Esc to cancel.